Miami Home Prices: $636K, Down 2.1% — 26 ZIPs Analyzed (2026)
$636,343. That’s what a typical home costs in Miami right now — and it’s actually less than last year.
The median home value in Miami dropped 2.1% year over year, landing at $636,343 as of February 2026. The decline marks a shift after years of aggressive price growth. Across 26 ZIP codes, prices range from just under $301K to over $1.5 million.
Quick answer: The average home price in Miami, FL is $636,343 as of February 2026, down 2.1% year over year according to Zillow.
Current Home Prices in Miami
| Metric | Value |
|---|---|
| Median Home Value | $636,343 |
| Year-over-Year Change | -2.1% |
| Lowest ZIP Value | $300,847 |
| Highest ZIP Value | $1,537,198 |
| Number of ZIPs Tracked | 26 |
| Data Through | February 2026 |
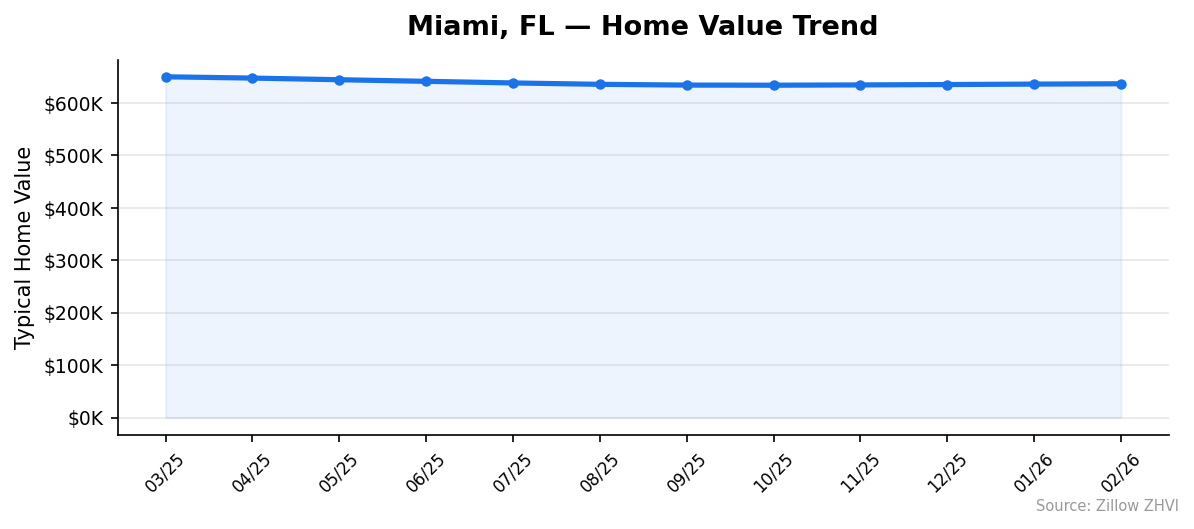
Miami’s median sits well above the national average, but the direction matters more than the number. A year ago, the median was $649,677. That’s a drop of about $13,300 in twelve months.
The decline hasn’t been dramatic. It’s been a slow grind lower — about $1,000 to $2,000 per month — since spring 2025. The floor appears to be firming up. Between November 2025 and February 2026, prices barely moved, ticking up from $634,169 to $636,343.
The spread between the cheapest and most expensive ZIP codes is massive: $1.2 million. That tells you Miami isn’t one market. It’s dozens.
Miami Home Prices by Neighborhood
| ZIP Code | Median Home Value | Median Rent |
|---|---|---|
| 33122 | $1,537,198 | $2,776 |
| 33133 | $1,286,313 | $3,486 |
| 33143 | $927,843 | $2,656 |
| 33138 | $777,810 | $2,286 |
| 33145 | $706,061 | $2,848 |
| 33187 | $704,939 | $3,572 |
| 33155 | $693,633 | $2,656 |
| 33129 | $687,230 | $3,373 |
| 33137 | $664,079 | $3,517 |
| 33176 | $617,525 | $2,387 |
| 33157 | $617,349 | $2,630 |
| 33144 | $608,218 | $2,357 |
| 33131 | $589,598 | $3,806 |
| 33170 | $567,525 | $3,092 |
| 33177 | $564,621 | $2,656 |
| 33173 | $562,242 | $2,674 |
| 33132 | $531,717 | $3,391 |
| 33135 | $518,731 | $2,086 |
| 33127 | $514,980 | $2,994 |
| 33130 | $510,688 | $3,156 |
| 33125 | $454,646 | $2,368 |
| 33193 | $441,671 | $2,412 |
| 33128 | $440,660 | $2,454 |
| 33183 | $395,466 | $2,536 |
| 33136 | $323,327 | $2,570 |
| 33126 | $300,847 | $2,363 |
Most Expensive ZIPs
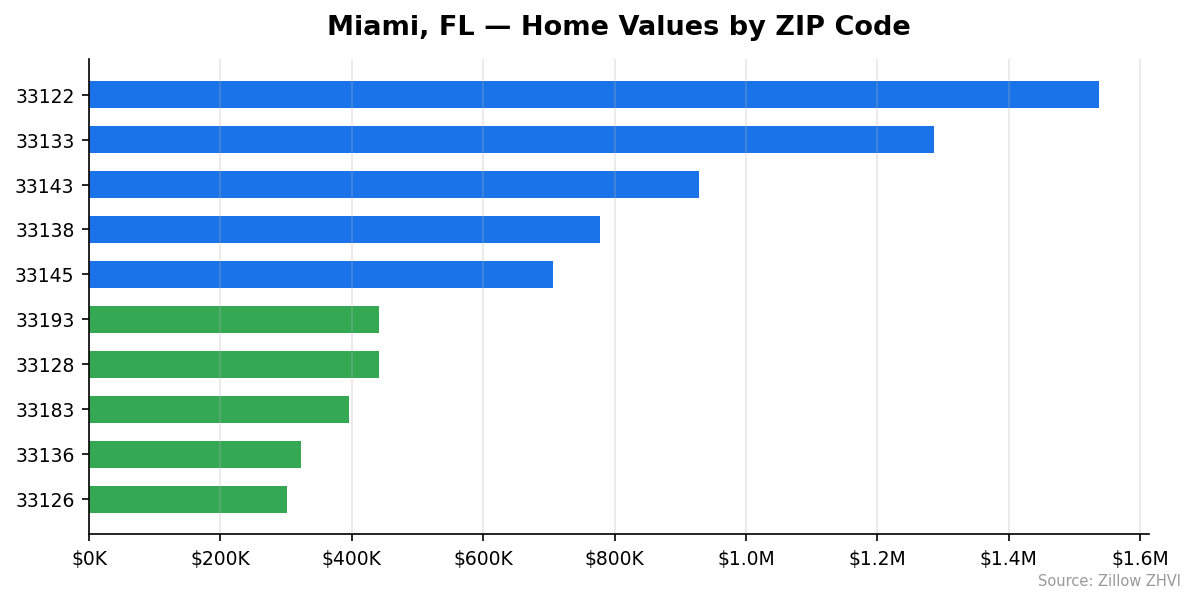
33122 leads Miami at $1,537,198 — more than double the city median — with relatively modest rents of $2,776, suggesting an owner-occupied market with larger properties. 33133 (Coconut Grove/Coral Gables border) comes in at $1,286,313 with the second-highest rents in the city at $3,486. 33143 rounds out the top three at $927,843, where rents track close to the city average despite home values 46% above the median.
Most Affordable ZIPs
33126 is the cheapest ZIP in Miami at $300,847 — less than half the city median — with rents of $2,363 making it one of the few areas where buying could pencil out. 33136 offers homes at $323,327, though rents there run $2,570, a relatively high rent-to-price ratio. 33183 at $395,466 is the most affordable option in southwest Miami, with rents of $2,536.
Rent vs Buy in Miami
Renting is cheaper than buying in most of Miami right now.
The average rent across all 26 tracked ZIP codes is approximately $2,812 per month. A mortgage on the median $636,343 home — assuming 20% down and a 7% rate — runs about $3,390 per month in principal and interest alone. Add property taxes, insurance, and HOA fees, and your monthly housing cost could easily top $4,500.
| Monthly Cost | Amount |
|---|---|
| Average Rent (ZORI) | ~$2,812 |
| Mortgage (P&I, 20% down, 7%) | ~$3,390 |
| Estimated Gap | ~$578 |
That gap widens further in expensive ZIPs. In 33131 (Brickell), rents average $3,806 — high, but still well below the mortgage payment on a $589,598 home.
The math flips in a few affordable areas. In 33126, a mortgage on a $300,847 home runs about $1,601/month — $762 less than the $2,363 average rent. ZIP 33136 is similar: the mortgage would be roughly $1,721 versus $2,570 in rent.
If you’re buying for the long term and can find a property in a sub-$400K ZIP, the numbers can work. At the city median, renting saves you money every month.
Population Growth and Migration
Miami added 44,186 residents between 2020 and 2024. That’s a 10% jump in four years, pushing the city’s population to 487,014.
| Year | Population |
|---|---|
| 2020 | 442,828 |
| 2021 | 441,630 |
| 2022 | 456,736 |
| 2023 | 470,677 |
| 2024 | 487,014 |
The city dipped slightly in 2021, losing about 1,200 people. But since then, growth has been consistent — roughly 15,000 new residents per year from 2022 onward.
How does that compare to other Florida cities?
| City | 2024 Population | 4-Year Growth |
|---|---|---|
| Port St. Lucie | 258,575 | 25.0% |
| Cape Coral | 233,025 | 19.2% |
| Orlando | 334,854 | 8.8% |
| Tampa | 414,547 | 6.7% |
| Jacksonville | 1,009,833 | 6.1% |
| Miami | 487,014 | 10.0% |
Miami’s 10% growth rate outpaces both Tampa and Jacksonville. Smaller cities like Port St. Lucie and Cape Coral are growing faster in percentage terms, but from a much lower base. More people means more housing demand — which makes the 2.1% price drop more notable. Supply is clearly catching up.
Miami Housing Market Trends
Here’s the full 12-month price trajectory:
| Month | Median Value | Min ZIP | Max ZIP |
|---|---|---|---|
| Mar 2025 | $649,677 | $328,740 | $1,539,644 |
| Apr 2025 | $647,200 | $326,062 | $1,544,305 |
| May 2025 | $644,073 | $322,094 | $1,551,115 |
| Jun 2025 | $641,054 | $317,844 | $1,555,410 |
| Jul 2025 | $637,941 | $313,220 | $1,559,590 |
| Aug 2025 | $635,317 | $309,447 | $1,562,245 |
| Sep 2025 | $633,851 | $306,611 | $1,563,271 |
| Oct 2025 | $633,633 | $304,748 | $1,561,018 |
| Nov 2025 | $634,169 | $303,524 | $1,557,099 |
| Dec 2025 | $634,870 | $302,581 | $1,554,021 |
| Jan 2026 | $635,739 | $301,991 | $1,548,167 |
| Feb 2026 | $636,343 | $300,847 | $1,537,198 |
Two trends stand out. The median declined steadily from March through October 2025, dropping about $16,000 over seven months. Then it bottomed out. Since October, the median has ticked up by $2,710.
Meanwhile, the most affordable ZIPs kept getting cheaper. The minimum ZIP value fell from $328,740 to $300,847 over the same period — a 8.5% drop. The most expensive ZIP also declined, falling from $1,539,644 to $1,537,198. The gap between top and bottom is compressing slightly at the top while the floor keeps sinking.
Is Miami a Good Place to Buy in 2026?
It depends on your price point.
If you’re looking in the $300K-$400K range, you have three ZIP codes to work with — 33126, 33136, and 33183. These areas offer entry prices where a mortgage undercuts average rents. With the city adding roughly 15,000 people per year, demand isn’t going away.
At the city median of $636K, the math is harder. You’re paying a premium over renting, and prices are still drifting lower in some areas. Buyers at this level have negotiating power they haven’t had in years.
The luxury end ($900K+) is a different market entirely. Only three ZIPs clear that mark, and they serve buyers who aren’t rate-sensitive.
One thing working in buyers’ favor: the 2.1% annual decline means sellers are adjusting expectations. That creates room for negotiation, especially on properties that have sat on the market.
Miami Housing Market Outlook for 2026-2027
The 12-month trend shows a market that’s finding its floor.
Prices dropped every month from March to October 2025, then reversed course with four consecutive months of small gains. The pace of decline slowed before it stopped — from $2,000+ monthly drops in summer to gains of $500-$600 per month since November.
If the current pace continues, Miami could close 2026 near $640,000 — essentially flat from here. The rapid declines appear to be over. But there’s no sign of a return to aggressive appreciation either.
The affordable end of the market tells a different story. Sub-$350K ZIPs are still losing value, which suggests ongoing price pressure in entry-level neighborhoods. Watch the minimum ZIP value over the next few months — if it stabilizes, the broader market correction is likely complete.
Similar Markets in FL
If you’re considering Miami, these Florida cities offer different price points and growth profiles:
- Fort Lauderdale — Just north in the same metro area, with its own beach-driven market and potentially different pricing.
- Hialeah — Miami’s neighboring city, often offering more affordable options for buyers priced out of Miami proper.
- Tampa — Florida’s west coast alternative, with 6.7% population growth and a lower price point than Miami.
- Orlando — Central Florida’s largest market, growing at 8.8% with a different economic base.
- Jacksonville — Florida’s most populated city at over 1 million residents, typically offering lower prices than South Florida.
Frequently Asked Questions
What is the average home price in Miami?
The average home price in Miami is $636,343 as of February 2026. That’s the citywide median across 26 ZIP codes, where individual neighborhoods range from $300,847 in 33126 to $1,537,198 in 33122.
Are home prices going up or down in Miami?
Prices are down 2.1% year over year. The median fell from $649,677 in March 2025 to $636,343 in February 2026. However, the decline appears to be slowing — prices have inched up slightly since bottoming at $633,633 in October 2025.
Is it cheaper to rent or buy in Miami?
Renting is cheaper in most neighborhoods. The average rent across Miami is about $2,812/month, while a mortgage on the median home costs roughly $3,390/month before taxes and insurance. The exception is the sub-$400K ZIPs, where monthly mortgage payments can actually be lower than local rents.
What is the most affordable neighborhood in Miami?
ZIP code 33126 is the most affordable, with a typical home value of $300,847. That’s 53% below the city median. ZIP 33136 at $323,327 is the second most affordable option.
Methodology
Home values are based on the Zillow Home Value Index (ZHVI), a smoothed measure of typical home values in the 35th to 65th percentile range. Rent estimates use the Zillow Observed Rent Index (ZORI). Population figures come from the U.S. Census Bureau Population Estimates Program (2020-2024 vintage). All datasets are publicly available. Housing data updated 2026-02-28.