Ogden Home Prices: $436K, Up 2.4% — 3 ZIPs Analyzed (2026)
$436K. That’s what a typical home costs in Ogden right now — and the number keeps climbing.
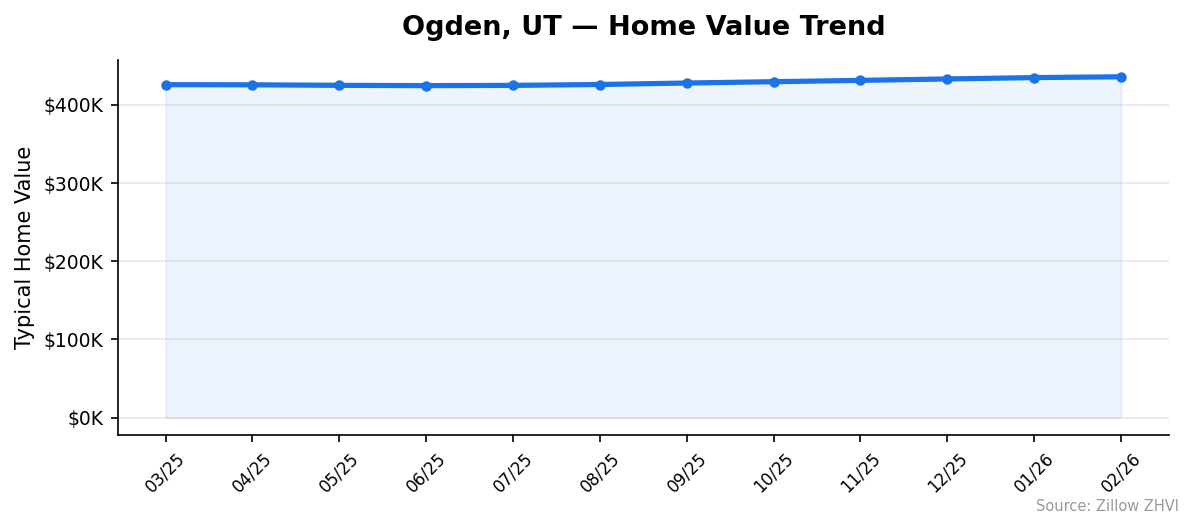
The Ogden housing market has posted steady gains over the past year, with the median home value reaching $435,658 as of February 2026. That’s a 2.4% increase year over year. Not a runaway market, but consistent upward pressure across all three tracked ZIP codes.
Quick answer: The average home price in Ogden, UT is $435,658 as of February 2026, up 2.4% year over year according to Zillow.
Current Home Prices in Ogden
| Metric | Value |
|---|---|
| Median Home Value | $435,658 |
| Year-over-Year Change | +2.4% |
| Lowest ZIP Median | $427,695 |
| Highest ZIP Median | $440,928 |
| ZIP Codes Tracked | 3 |
| Data as of | February 2026 |
The spread between the cheapest and most expensive ZIP code is only about $13,200. That’s unusually tight for a city of this size. It means your neighborhood choice in Ogden doesn’t swing your price tag by much — maybe $50/month on a mortgage payment.
Over the last 12 months, values moved from $425,600 in March 2025 to $435,658 in February 2026. That works out to roughly $838 per month in appreciation. If you bought a year ago, your home gained about $10,000 in value.
The 2.4% annual gain trails some of the hotter Utah markets, but it outpaces inflation. For a mid-size city along the Wasatch Front, that’s a sign of stable demand without the frothiness that leads to sharp corrections.
Ogden Home Prices by Neighborhood
| ZIP Code | Median Home Value | Avg Monthly Rent |
|---|---|---|
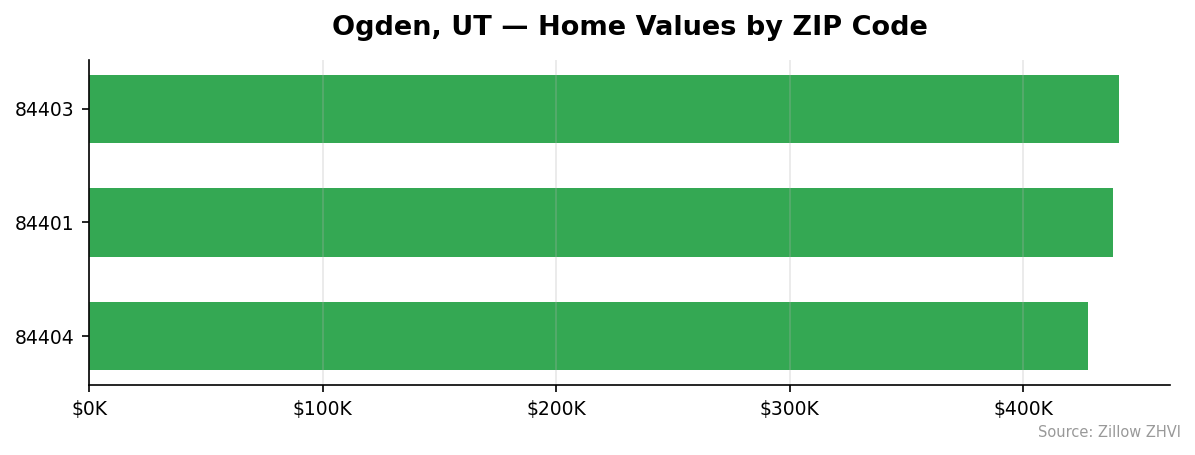
| 84403 | $440,928 | $1,317 |
| 84401 | $438,351 | $1,424 |
| 84404 | $427,695 | $1,737 |
Most Expensive
84403 tops the list at $440,928, about $5,300 above the city median, yet it carries the lowest average rent at $1,317 — suggesting more owner-occupied properties and fewer rentals.
84401 comes in at $438,351, sitting close to the city average with moderate rents of $1,424 per month.
Most Affordable
84404 is the least expensive ZIP at $427,695, roughly $8,000 below the city median. Interestingly, it has the highest rents at $1,737 — a mismatch that could signal strong rental demand or a different housing stock mix with more multi-family units.
The rent inversion is worth noting. The cheapest ZIP to buy in is the most expensive to rent. If you’re a renter in 84404 paying $1,737 per month, the math on buying starts to look more interesting than it does elsewhere in the city.
Rent vs Buy in Ogden
Here’s the rent picture across Ogden’s ZIP codes:
| ZIP Code | Avg Monthly Rent | Median Home Value | Est. Monthly Mortgage |
|---|---|---|---|
| 84404 | $1,737 | $427,695 | ~$2,740 |
| 84401 | $1,424 | $438,351 | ~$2,810 |
| 84403 | $1,317 | $440,928 | ~$2,825 |
Estimated mortgage assumes 20% down and a 6.5% interest rate on a 30-year fixed loan.
Renting is cheaper across the board. The gap ranges from about $1,000 per month in 84404 to roughly $1,500 in 84403. That’s a significant difference.
But the math changes when you factor in equity. At 2.4% annual appreciation, a $435,658 home gains roughly $10,400 per year. Divide that by 12, and you’re effectively getting $870/month in equity buildup on top of your mortgage payment.
In 84404, where rent is $1,737 and the estimated mortgage is $2,740, the gap after accounting for appreciation narrows to about $170/month. That’s close enough that buying could make sense if you plan to stay five years or more.
In 84403, renting still wins on a pure cash flow basis. You’d save over $600 per month even after appreciation.
Population Growth and Migration
Ogden’s population hit 88,656 in 2024, a modest 1.6% increase from 87,299 in 2020.
| Year | Population | Change |
|---|---|---|
| 2020 | 87,299 | — |
| 2021 | 86,659 | -640 |
| 2022 | 86,934 | +275 |
| 2023 | 87,525 | +591 |
| 2024 | 88,656 | +1,131 |
The trajectory dipped in 2021 before reversing. The last two years show accelerating growth — 2024 added 1,131 residents, more than double the 2023 gain.
How does Ogden compare to other Utah cities?
| City | 2024 Population | 4-Year Growth |
|---|---|---|
| Salt Lake City | 217,783 | +8.5% |
| St. George | 106,288 | +10.7% |
| Lehi | 93,446 | +21.6% |
| Ogden | 88,656 | +1.6% |
| South Jordan | 86,156 | +10.5% |
| Layton | 84,348 | +2.8% |
Ogden’s 1.6% growth is the slowest in this group. Lehi exploded at 21.6%, and even nearby Layton nearly doubled Ogden’s rate. That slower growth is part of why home prices here remain more moderate than in Utah’s boom towns. Less population pressure means less bidding competition.
Still, the trend is positive and accelerating. More people moving in means more demand for housing, even if it’s gradual.
Ogden Housing Market Trends
| Month | Avg Value | Low | High |
|---|---|---|---|
| Feb 2026 | $435,658 | $427,695 | $440,928 |
| Jan 2026 | $434,640 | $426,879 | $439,880 |
| Dec 2025 | $432,906 | $425,283 | $437,745 |
| Nov 2025 | $431,080 | $423,594 | $435,365 |
| Oct 2025 | $429,382 | $422,162 | $433,024 |
| Sep 2025 | $427,689 | $420,826 | $431,674 |
| Aug 2025 | $425,795 | $419,279 | $430,131 |
| Jul 2025 | $424,687 | $418,370 | $429,408 |
| Jun 2025 | $424,357 | $417,992 | $429,661 |
| May 2025 | $424,747 | $418,187 | $430,533 |
| Apr 2025 | $425,396 | $418,538 | $431,584 |
| Mar 2025 | $425,600 | $418,728 | $431,784 |
Twelve consecutive months of data tell a clear story. Prices bottomed around June 2025 at $424,357, then climbed steadily through the winter.
The acceleration picked up in the second half. From March to June 2025, values actually drifted slightly downward — a $1,243 dip. From June 2025 to February 2026, they rose $11,301. That’s a distinct shift from flat to upward.
The gap between the cheapest and most expensive ZIP stayed remarkably stable at around $13,000 throughout the year. All neighborhoods moved in lockstep.
Is Ogden a Good Place to Buy in 2026?
The numbers point to a balanced market leaning slightly toward sellers.
Prices are rising, but at 2.4% annually — not fast enough to create panic among buyers. You’re not competing against double-digit appreciation that prices people out month by month. There’s time to shop.
For buyers: Ogden remains one of the more affordable cities along the Wasatch Front. At $436K, you’re well below Salt Lake City prices. The tight spread across ZIP codes means you don’t need to hunt for a “deal” neighborhood — the whole city is within a narrow band.
For sellers: Steady appreciation means your home is worth more each month, but don’t expect bidding wars. The slow population growth (1.6% over four years) limits the urgency buyers feel.
If you’re renting in 84404 and paying $1,737, run the numbers on buying. The gap is smaller than you’d think.
Ogden Housing Market Outlook for 2026-2027
The 8-month upward trend from June 2025 through February 2026 shows no signs of flattening. Monthly gains have been consistent, averaging about $1,400 per month over that stretch.
If the current pace continues through mid-2026, the median could reach the $440,000–$445,000 range by summer. The 3-month trend from December to February shows gains of roughly $1,400/month, matching the longer trend — no slowdown visible yet.
One factor to watch: Ogden’s population growth accelerated sharply in 2024. If that continues, it could push demand — and prices — faster than the 2.4% annual rate suggests.
A correction isn’t impossible, but the data doesn’t point to one. Prices flatlined briefly in spring 2025 rather than dropping, which suggests a floor around the $424,000–$425,000 level.
Similar Markets in UT
If you’re weighing Ogden against other Utah cities, here are a few to compare:
- Salt Lake City — The state’s largest city with faster population growth at 8.5%, likely commanding higher prices.
- West Valley City — A Salt Lake suburb that may offer a different price point for Ogden buyers willing to commute south.
- Provo — College-town market with a different buyer demographic, worth comparing if you’re flexible on location.
- Sandy — Another Wasatch Front option between Ogden and Provo.
- Orem — Adjacent to Provo, offering another mid-size market alternative.
Frequently Asked Questions
What is the average home price in Ogden?
The median home value in Ogden is $435,658 as of February 2026. Across the city’s three tracked ZIP codes, prices range from $427,695 in 84404 to $440,928 in 84403. The city-wide average has been climbing steadily since mid-2025.
Are home prices going up or down in Ogden?
Prices are going up. The year-over-year increase is 2.4%, and values have risen every single month since June 2025. The low point was $424,357 in June 2025, and the market has gained over $11,000 since then.
Is it cheaper to rent or buy in Ogden?
Renting is cheaper on a monthly cash basis. Average rents range from $1,317 to $1,737 across Ogden’s ZIPs, while an estimated mortgage payment on a median-priced home runs about $2,740–$2,825. However, in ZIP 84404 where rents are highest, the gap narrows significantly when you factor in equity gains from appreciation.
What is the most affordable neighborhood in Ogden?
ZIP code 84404 is the most affordable at $427,695, roughly $8,000 below the city median. Despite lower home prices, this ZIP has the highest average rent at $1,737 — an unusual mismatch that could benefit buyers over renters in the long run.
Methodology
Home values are based on the Zillow Home Value Index (ZHVI), a smoothed measure of typical home values in the 35th to 65th percentile range. Rent estimates use the Zillow Observed Rent Index (ZORI). Population figures come from the U.S. Census Bureau Population Estimates Program (2020-2024 vintage). All datasets are publicly available. Housing data updated 2026-02-28.