Providence Home Prices: $453K, Up 2.6% — 7 ZIPs Analyzed (2026)
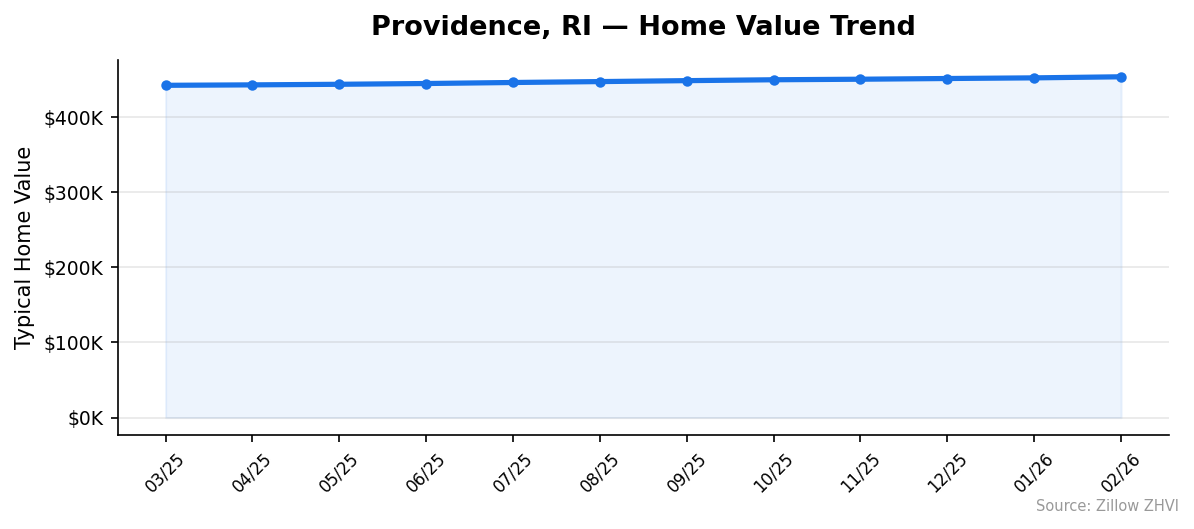
$453,408. That’s what a typical Providence home is worth as of February 2026. Prices climbed 2.6% over the past year, and the monthly data shows fourteen straight months of gains.
Quick answer: The average home price in Providence, RI is $453,408 as of February 2026, up 2.6% year over year according to Zillow.
Current Home Prices in Providence
Providence sits in the mid-$400Ks. The floor and ceiling tell a different story.
| Metric | Value |
|---|---|
| Median home value | $453,408 |
| Year-over-year change | +2.6% |
| Cheapest ZIP | $374,611 (02909) |
| Most expensive ZIP | $775,827 (02906) |
| Price spread (low to high) | $401,216 |
| ZIP codes analyzed | 7 |
| Metro area | Providence-Warwick, RI-MA |
The gap between the cheapest and most expensive ZIP is more than $400,000. That’s the widest divergence you’ll see in a city this size. ZIP 02906 — home to Brown University’s East Side — trades at more than double the price of 02909 on the west side.
Year-over-year gains of 2.6% are modest by Providence’s recent standards but still outpace wage growth in most sectors. The typical buyer paying the median in February 2026 spent about $11,300 more than a buyer who closed in March 2025.
Inventory varies sharply by neighborhood. Prices are climbing across all seven ZIPs tracked, but at different rates, which the ZIP table below breaks down.
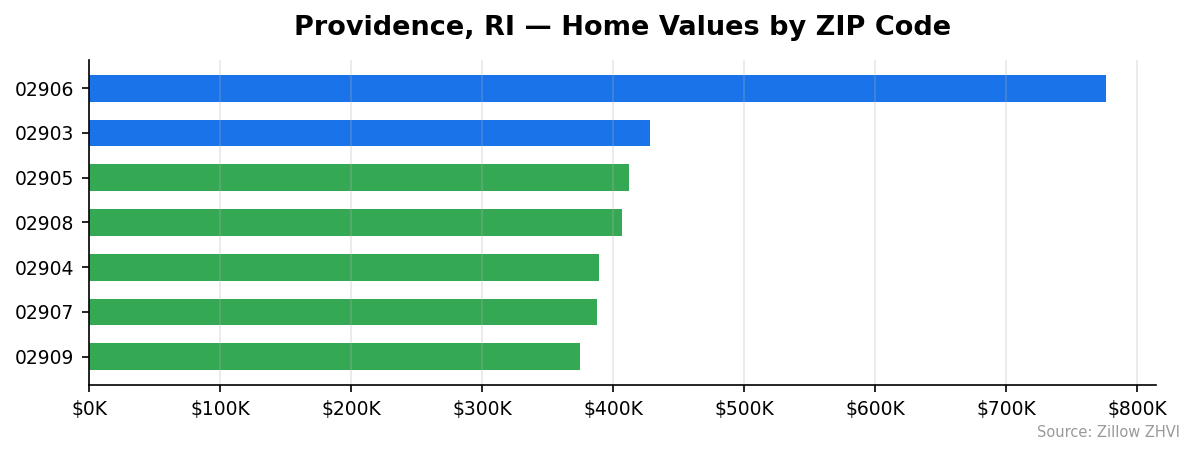
Providence Home Prices by Neighborhood
Seven ZIPs. One outlier. The rest cluster within a $55K band.
| ZIP Code | Home Value | Avg Rent | vs City Median |
|---|---|---|---|
| 02906 | $775,827 | $2,394 | +71% |
| 02903 | $427,898 | $2,399 | -6% |
| 02905 | $411,931 | $1,892 | -9% |
| 02908 | $406,549 | $2,185 | -10% |
| 02904 | $389,294 | $1,847 | -14% |
| 02907 | $387,744 | $1,781 | -14% |
| 02909 | $374,611 | $2,144 | -17% |
Most Expensive
- 02906 — $775,827. The East Side and College Hill. At 71% above the city median, this is the only ZIP in Providence that trades in the $700Ks, with rents averaging $2,394.
- 02903 — $427,898. Downtown and Federal Hill. Rents here are actually the highest in the city at $2,399, even though home values sit below the median.
- 02905 — $411,931. The South Side waterfront areas. Home values are 9% below the city average but rents stay moderate at $1,892.
Most Affordable
- 02909 — $374,611. The cheapest ZIP in Providence, 17% below median. Rent averages $2,144, meaning the rent-to-price ratio here is unusually high for the city.
- 02907 — $387,744. Elmwood and surrounding areas. Lowest rents in the city at $1,781 pair with below-median home values.
- 02904 — $389,294. North Providence border. Similar price to 02907 but with slightly higher rents at $1,847.
Rent vs Buy in Providence
Rents in Providence span $1,781 to $2,399 per month, depending on the ZIP. The citywide rent average across the seven ZIPs works out to roughly $2,092.
Compare that to ownership. A $453,408 home with 20% down ($90,682) and a 30-year mortgage at 7% leaves a principal-and-interest payment near $2,413. Add property taxes (Rhode Island’s effective rate runs about 1.4%) and insurance, and monthly carrying costs push past $3,100.
| Scenario | Monthly Cost |
|---|---|
| Average rent (7-ZIP mean) | ~$2,092 |
| Mortgage P&I (20% down, 7%, 30yr) | ~$2,413 |
| Mortgage + taxes + insurance | ~$3,100+ |
| Gap (buy vs rent) | ~$1,000/mo |
Renting saves roughly $1,000 a month on cash flow in Providence right now. That math flips only if you believe home prices will keep climbing at 2.6% or faster — at that pace, the equity gained plus tax benefits can offset the higher monthly cost over several years.
The cheapest rents (02907, 02904) pair with mid-tier home prices, which makes those ZIPs the most renter-favorable. The 02903 downtown ZIP has the odd distinction of offering the highest rents in the city despite below-median home values.
Population Growth and Migration
Providence added residents. Not by much, but the trend is positive.
| Year | Population |
|---|---|
| 2020 | 190,803 |
| 2021 | 190,200 |
| 2022 | 190,879 |
| 2023 | 192,606 |
| 2024 | 194,706 |
The city lost population briefly in 2021, then recovered and grew each year since. Four-year growth sits at 2.0% — a net gain of 3,903 people since 2020.
Compare Providence to nearby Rhode Island cities:
| City | 2024 Population | 4-Year Growth |
|---|---|---|
| Providence | 194,706 | +2.0% |
| Cranston | 84,448 | +2.0% |
| Pawtucket | 76,996 | +2.0% |
| Warwick | 83,554 | +0.8% |
Providence, Cranston, and Pawtucket are all growing at the same 2.0% pace. Warwick is the laggard at 0.8%. Steady growth across the metro supports continued demand for housing, which aligns with the price trajectory you see in the Zillow data.
A city adding roughly 1,000 residents a year doesn’t create explosive price pressure. But it rules out the supply-side collapse you see in shrinking markets. Providence is holding its ground demographically.
Providence Housing Market Trends
Fourteen months. Fourteen gains. Not a single monthly dip.
| Month | Avg Home Value | MoM Change |
|---|---|---|
| 2026-02 | $453,408 | +0.3% |
| 2026-01 | $451,983 | +0.2% |
| 2025-12 | $451,119 | +0.2% |
| 2025-11 | $450,173 | +0.2% |
| 2025-10 | $449,450 | +0.3% |
| 2025-09 | $448,283 | +0.3% |
| 2025-08 | $447,024 | +0.3% |
| 2025-07 | $445,816 | +0.3% |
| 2025-06 | $444,464 | +0.2% |
| 2025-05 | $443,433 | +0.2% |
| 2025-04 | $442,655 | +0.1% |
| 2025-03 | $442,074 | — |
From March 2025 to February 2026, the typical Providence home gained $11,334 — a 2.6% lift. Monthly gains have been remarkably consistent, hovering between 0.1% and 0.3%.
The pace is accelerating slightly. The last three months averaged 0.27% monthly growth. The first three months of the window averaged 0.18%. Not a dramatic shift, but the direction is higher, not lower.
The top-end ZIP (02906) climbed from $735,090 to $775,827 over the same twelve months — a 5.5% gain. High-end Providence is outpacing the citywide average.
Is Providence a Good Place to Buy in 2026?
You’re buying into a seller’s market. Modestly.
Prices have gained every month for over a year. The 2.6% annual appreciation isn’t dramatic, but it’s consistent. There’s no sign of a correction in the monthly data — no flattening, no dips, no volatility. That’s the signature of tight inventory.
The city has seven distinct ZIPs, and six of them trade below the citywide median. That gives buyers room to negotiate on price by expanding their search radius. Moving from 02906 to 02905 saves you $363,896 on the typical home — for many buyers, that’s worth accepting a different neighborhood.
Rent-vs-buy math currently favors renting by about $1,000 a month. If you’re confident you’ll stay five or more years, the appreciation math starts to catch up. Short timelines favor renting.
Population is growing at 2.0% over four years — enough to keep demand steady, not enough to spark a bidding frenzy.
Providence Housing Market Outlook for 2026-2027
The 3-month trend suggests continued appreciation. Monthly gains accelerated from 0.18% early in the window to 0.27% recently.
If the current pace continues, the typical Providence home would cross $460,000 by mid-2026 and approach $470,000 by year-end. That would put annual appreciation near 3%, modestly above the current 2.6% rate.
Nothing in the twelve-month trend hints at a reversal. Every month posted a gain. The high-end 02906 ZIP is accelerating faster than the rest of the city, suggesting buyer demand remains strongest at the top of the market.
Watch the monthly data. A single flat month after fourteen consecutive gains would be the first signal worth noting. Until that happens, the base case is continued slow appreciation in the 2-3% annual range.
Similar Markets in RI
- Cranston — Providence’s largest neighbor, similar 2.0% population growth but typically lower home values.
- Warwick — Slower-growing (0.8%) suburb south of the city, often a target for buyers priced out of Providence proper.
- East Providence — Directly across the Seekonk River, a common alternative for buyers who want city access without Providence prices.
- Scituate — Smaller, more rural RI market west of Providence for buyers prioritizing space over walkability.
- Richmond — Southern Rhode Island small town, further from Providence but typically more affordable.
Frequently Asked Questions
What is the average home price in Providence?
The average home price in Providence, RI is $453,408 as of February 2026. That figure reflects the Zillow Home Value Index across the seven ZIP codes tracked within the city. Values range from $374,611 in 02909 to $775,827 in 02906.
Are home prices going up or down in Providence?
Prices are up. Providence home values rose 2.6% year over year through February 2026, and the monthly data shows fourteen consecutive months of gains. The pace is modestly accelerating, with recent months posting 0.2-0.3% growth.
Is it cheaper to rent or buy in Providence?
Renting is cheaper month to month. Average rent across Providence ZIPs runs near $2,092, while a mortgage on the $453,408 median home — after 20% down at 7% — runs roughly $2,413 for principal and interest alone, or $3,100+ including taxes and insurance. Owning costs about $1,000 more per month than renting.
What is the most affordable neighborhood in Providence?
ZIP 02909 is the cheapest, with a typical home value of $374,611 — about 17% below the citywide median. The next most affordable is 02907 at $387,744, which also has the lowest average rent in the city at $1,781.
Methodology
Home values are based on the Zillow Home Value Index (ZHVI), a smoothed measure of typical home values in the 35th to 65th percentile range. Rent estimates use the Zillow Observed Rent Index (ZORI). Population figures come from the U.S. Census Bureau Population Estimates Program (2020-2024 vintage). All datasets are publicly available. Housing data updated 2026-02-28.