Cranston Home Prices: $485K, Up 0.8% — 3 ZIPs Analyzed (2026)
$485,370. That’s the typical home value in Cranston as of February 2026. Prices are up 0.8% over the past year — a near-flat market sitting close to its all-time high.
Quick answer: The average home price in Cranston, RI is $485,370 as of February 2026, up 0.8% year over year according to Zillow.
Current Home Prices in Cranston
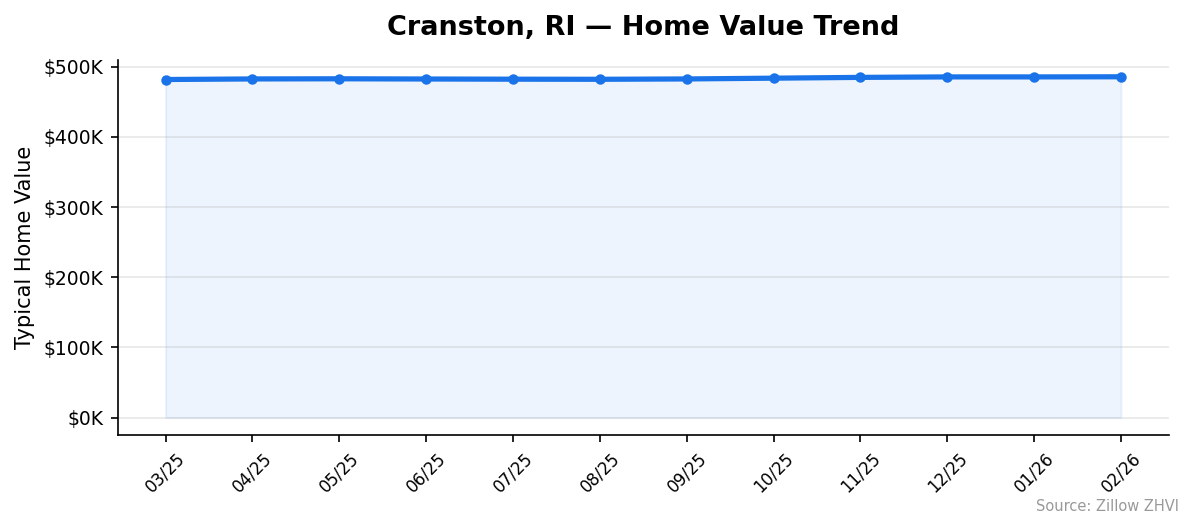
The Cranston housing market has barely moved in twelve months. The typical home is worth $485,370, compared with $481,501 in March 2025. That’s a $3,869 gain — slower than the rate of consumer inflation.
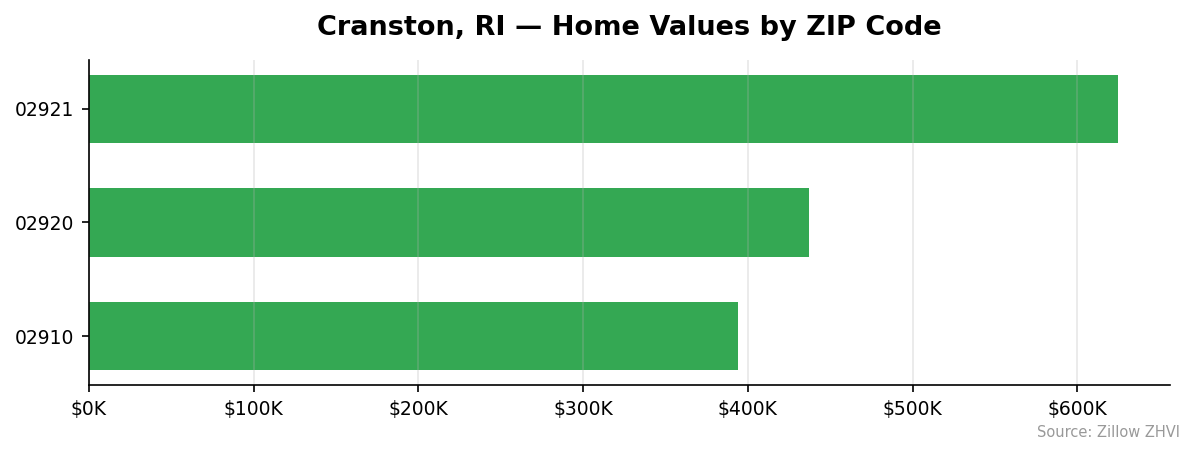
Inside the city, prices stretch from under $400K to over $625K depending on the ZIP code. The spread between the cheapest and most expensive neighborhood tops $230,000.
| Metric | Value |
|---|---|
| Median home value | $485,370 |
| Year-over-year change | +0.8% |
| Lowest ZIP price | $394,167 (02910) |
| Highest ZIP price | $625,017 (02921) |
| ZIP codes tracked | 3 |
| Metro area | Providence-Warwick, RI-MA |
| Data through | February 2026 |
You’re not seeing a boom. You’re not seeing a correction either. Cranston has settled into a holding pattern. Neighboring Providence and Warwick are part of the same metro and face the same demand picture: not enough listings, but stretched buyer budgets keeping bids in check.
The 0.8% gain trails most measures of inflation, which means real home values have actually slipped slightly. Owners aren’t losing money on paper. But they aren’t building wealth fast either.
Cranston Home Prices by Neighborhood
Three ZIP codes carry the Cranston market. The price gap between them is wider than the city average suggests.
| ZIP Code | Median Home Value | Median Rent |
|---|---|---|
| 02921 | $625,017 | Data not available |
| 02920 | $436,926 | $1,957 |
| 02910 | $394,167 | $1,802 |
Most Expensive
- 02921 — $625,017. Western Cranston, sitting 29% above the city average. It’s the only ZIP in town pricing into the $600K range.
- 02920 — $436,926. The middle of the market, roughly 10% below the city average. Also the most active rental ZIP at $1,957 per month.
- 02910 — $394,167. Even Cranston’s third-most-expensive ZIP comes in well under the city median.
Most Affordable
- 02910 — $394,167. The cheapest ZIP in Cranston, about 19% below the city median, with rents averaging $1,802.
- 02920 — $436,926. The mid-range option, $48,000 below the city average and a strong rental market.
- 02921 — $625,017. Even the most expensive ZIP joins this list because Cranston has just three ZIPs to compare.
Rent vs Buy in Cranston
Two of three Cranston ZIPs have rent data. The picture favors renters.
| ZIP | Median Rent (Monthly) |
|---|---|
| 02920 | $1,957 |
| 02910 | $1,802 |
Average those and you get $1,879 per month for a typical Cranston rental. Now run the buy side. A $485,370 home with 20% down is a $388,296 loan. At a 7% rate over 30 years, principal and interest alone is roughly $2,580 per month. Add property taxes and insurance and you’re closer to $3,200 monthly.
The math: buying costs you about $1,300 more per month than renting in Cranston right now, before maintenance. The gap funds a lot of utility bills.
The case for buying still works if you’re staying long-term, want to lock in your housing cost, or need the tax deduction. For short-term residents or anyone uncertain about staying in Rhode Island, the numbers point at renting and investing the difference.
ZIP 02921 has no rent index. The neighborhood is heavily owner-occupied, which limits the rental sample size that can be tracked.
Population Growth and Migration
Cranston is growing — slowly. The population hit 84,448 in 2024, up from 82,772 in 2020. That’s 1,676 new residents over four years, a 2.0% gain.
| Year | Population |
|---|---|
| 2020 | 82,772 |
| 2021 | 82,574 |
| 2022 | 82,943 |
| 2023 | 83,412 |
| 2024 | 84,448 |
Growth wasn’t linear. The city actually lost residents in 2021, a pandemic-era dip seen across much of the Northeast. Recovery started in 2022 and accelerated in 2024, when Cranston added more than 1,000 people in a single year.
Here’s how Cranston compares with its neighbors:
| City | 2024 Population | 4-Year Growth |
|---|---|---|
| Providence | 194,706 | +2.0% |
| Cranston | 84,448 | +2.0% |
| Warwick | 83,554 | +0.8% |
| Pawtucket | 76,996 | +2.0% |
Cranston is keeping pace with Providence and Pawtucket, and growing more than twice as fast as Warwick next door. Steady population growth supports housing demand without flooding the market — which helps explain why prices haven’t fallen even as transaction volume slowed.
Cranston Housing Market Trends
Twelve months of data show a market grinding sideways with a slight upward drift.
| Month | Median Value |
|---|---|
| Mar 2025 | $481,501 |
| Apr 2025 | $482,310 |
| May 2025 | $482,517 |
| Jun 2025 | $482,217 |
| Jul 2025 | $481,949 |
| Aug 2025 | $481,803 |
| Sep 2025 | $482,301 |
| Oct 2025 | $483,395 |
| Nov 2025 | $484,525 |
| Dec 2025 | $485,200 |
| Jan 2026 | $485,195 |
| Feb 2026 | $485,370 |
The summer cooled. Values dipped from May through August before turning. That’s normal seasonality on top of weak demand. From October on, the market regained momentum. Five of the last six months posted gains.
The total range over twelve months is just $3,869. Cranston isn’t volatile right now. Whether you bought a year ago or last month, your equity hasn’t moved much either way.
Is Cranston a Good Place to Buy in 2026?
The signal here is balance, not urgency. With prices up just 0.8% year over year and inventory in a metro known for tight supply, you’re not racing the clock. Sellers can’t demand huge premiums and buyers aren’t seeing fire-sale discounts.
If you’re a buyer, that means you have time. The under-$400K entry point at ZIP 02910 still exists, and rent in that same area runs well below what a mortgage would cost — so you can keep saving while you shop.
If you’re a seller, you’re listing into a market that absorbs homes but doesn’t bid them up. Pricing realistically matters more than ever. An aspirational ask will sit.
For long-term owners, the Census data is the most encouraging signal: a city adding 1,000+ residents per year doesn’t typically see prices crash. Demand is real, just patient.
Cranston Housing Market Outlook for 2026-2027
The 3-month trend is essentially flat — prices moved $170 from December to February. The 6-month trend points up by $3,069, or roughly 0.6%.
If the current pace continues, Cranston ends 2026 somewhere between $487,000 and $490,000. That assumes mortgage rates stay near current levels and population growth holds.
The risk to this outlook isn’t a crash. Cranston’s small ZIP count and tight inventory don’t support that scenario. The risk is a freeze, where listings slow and the index drifts because so few homes change hands. A fast-moving rate cut could break the pattern in either direction. Watch the spread between asking and closing prices over the next two quarters — that gap will move before the median does.
Similar Markets in RI
- Providence — Cranston’s larger neighbor sets the metro tone; pricing pressure tracks closely.
- Warwick — Comparable population (83,554) with slower growth, often a similar price point.
- East Providence — Another inner-ring Providence suburb worth comparing on commute and schools.
- Scituate — A more rural option west of the city for buyers wanting acreage.
- Burrillville — Northern Rhode Island, typically lower prices than Cranston for similar square footage.
Frequently Asked Questions
What is the average home price in Cranston?
The average home value in Cranston is $485,370 as of February 2026. That’s based on the Zillow Home Value Index across the city’s three tracked ZIP codes. Individual ZIPs range from $394,167 in 02910 to $625,017 in 02921.
Are home prices going up or down in Cranston?
Up, but barely. The year-over-year change is +0.8%, with the median rising from $481,501 in March 2025. The pace has been almost flat for the last six months, suggesting a market in equilibrium rather than a clear trend.
Is it cheaper to rent or buy in Cranston?
Renting is cheaper right now. Average Cranston rent is around $1,879 per month based on the two ZIPs with data, while a mortgage on the median home with 20% down would run roughly $3,200 per month including taxes and insurance. The buy-versus-rent gap is about $1,300 monthly.
What is the most affordable neighborhood in Cranston?
ZIP 02910 is the most affordable, with a median home value of $394,167 — about 19% below the city average. Rent there averages $1,802 per month, also the lowest of the ZIPs tracked. The area offers Cranston’s most accessible entry point for first-time buyers.
Methodology
Home values are based on the Zillow Home Value Index (ZHVI), a smoothed measure of typical home values in the 35th to 65th percentile range. Rent estimates use the Zillow Observed Rent Index (ZORI). Population figures come from the U.S. Census Bureau Population Estimates Program (2020-2024 vintage). All datasets are publicly available. Housing data updated 2026-02-28.