Kalamazoo Home Prices: $222K, Up 4.3% — 5 ZIPs Analyzed (2026)
$221,999. That’s the typical home value in Kalamazoo as of February 2026. Prices are up 4.3% from a year ago, bucking the flat-to-negative trend in parts of the Midwest.
Quick answer: The average home price in Kalamazoo, MI is $221,999 as of February 2026, up 4.3% year over year.
Current Home Prices in Kalamazoo
The Kalamazoo housing market is modest by national standards. A typical home sits well under the U.S. median, and price movement has been steady rather than wild.
| Metric | Value |
|---|---|
| Typical home value (Feb 2026) | $221,999 |
| Year-over-year change | +4.3% |
| Cheapest ZIP (typical value) | $117,809 |
| Most expensive ZIP (typical value) | $361,475 |
| ZIP codes analyzed | 5 |
| Metro area | Kalamazoo-Portage, MI |
The spread between the cheapest and most expensive ZIP is about $243,666. That’s a 3.1x multiple — a wide gap for a city this size. It means the Kalamazoo label covers very different housing markets depending on which side of the city you shop.
The 4.3% annual gain translates to roughly $9,057 in added paper equity for an owner who bought last spring. Nothing dramatic, but a positive number at a time when places like Austin and San Antonio have seen values fall.
Kalamazoo’s trajectory looks more like small-city Michigan than the coastal boom-and-bust cycle. The metro has neither the tech-fueled surges nor the sharp corrections you see in Sun Belt markets.
Kalamazoo Home Prices by Neighborhood
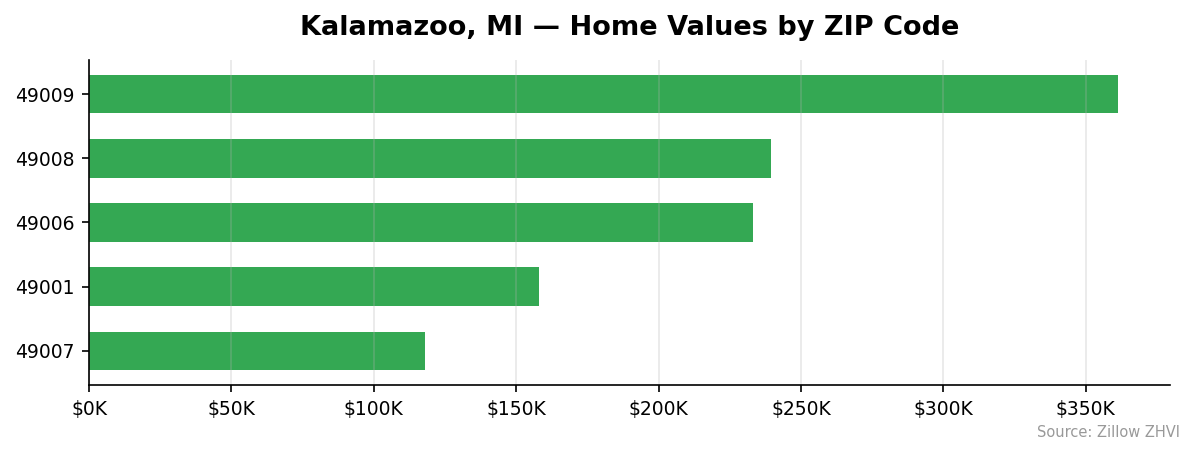
Five ZIP codes make up the Kalamazoo housing picture. The gap between them is the real story.
| ZIP Code | Typical Home Value | Monthly Rent (ZORI) |
|---|---|---|
| 49009 | $361,475 | $1,294 |
| 49008 | $239,571 | $1,300 |
| 49006 | $233,301 | $1,568 |
| 49001 | $157,838 | $1,110 |
| 49007 | $117,809 | $1,253 |
Most Expensive
49009 — $361,475. Roughly 63% above the city median and the only ZIP north of $300K in Kalamazoo.
49008 — $239,571. About 8% above the city median, with rent at $1,300 per month.
49006 — $233,301. Slightly above the median on home value, but the highest monthly rent in the city at $1,568.
Most Affordable
49007 — $117,809. The cheapest ZIP by a wide margin, at nearly half the citywide median. Rent there still runs $1,253, making it the best rent-to-own flip candidate.
49001 — $157,838. About 29% below the city median, with the lowest rent in town at $1,110.
49006 — $233,301 (listed again here as the cheapest of the “non-cheap” tier). Home value sits near the city average.
Rent vs Buy in Kalamazoo
Rent and home value don’t move in lockstep across Kalamazoo’s ZIPs. That creates pockets where buying looks smart and pockets where it doesn’t.
Run the price-to-rent ratio (home value divided by annual rent) and the disparity becomes obvious:
| ZIP | Home Value | Annual Rent | Price-to-Rent Ratio |
|---|---|---|---|
| 49007 | $117,809 | $15,037 | 7.8 |
| 49001 | $157,838 | $13,324 | 11.8 |
| 49006 | $233,301 | $18,821 | 12.4 |
| 49008 | $239,571 | $15,598 | 15.4 |
| 49009 | $361,475 | $15,522 | 23.3 |
A ratio under 15 generally favors buying. Over 20 tilts toward renting. In Kalamazoo, three of five ZIPs sit in clear buy territory. 49009 is the outlier — its homes are priced like a ratio-20 suburb, but rents haven’t caught up.
For a renter paying the citywide average of around $1,305 per month, that’s $15,660 a year out the door. Over five years, $78,300. The same money going toward a $150,000 home in 49001 or 49007 builds equity instead.
Population Growth and Migration
Kalamazoo’s population is flat. That matters for housing demand.
| Year | Population |
|---|---|
| 2020 | 73,489 |
| 2021 | 72,281 |
| 2022 | 72,911 |
| 2023 | 73,384 |
| 2024 | 73,290 |
The four-year net change is -0.3%. The city lost residents in 2021, clawed most of them back by 2023, then slipped slightly in 2024. This isn’t a shrinking city in any meaningful sense — but it’s not growing either.
Compare that to other Michigan cities:
| City | 2024 Population | 4-Year Growth |
|---|---|---|
| Troy | 89,209 | +2.4% |
| Lansing | 114,336 | +1.6% |
| Detroit | 645,705 | +1.1% |
| Grand Rapids | 200,117 | +0.7% |
| Farmington Hills | 84,173 | +0.4% |
| Kalamazoo | 73,290 | -0.3% |
Every other major Michigan city in this comparison is adding people. Kalamazoo is the only one losing them. That puts a ceiling on long-term demand and helps explain why prices haven’t exploded despite the national housing crunch. If you buy here, you’re buying a stable market, not a booming one.
Kalamazoo Housing Market Trends
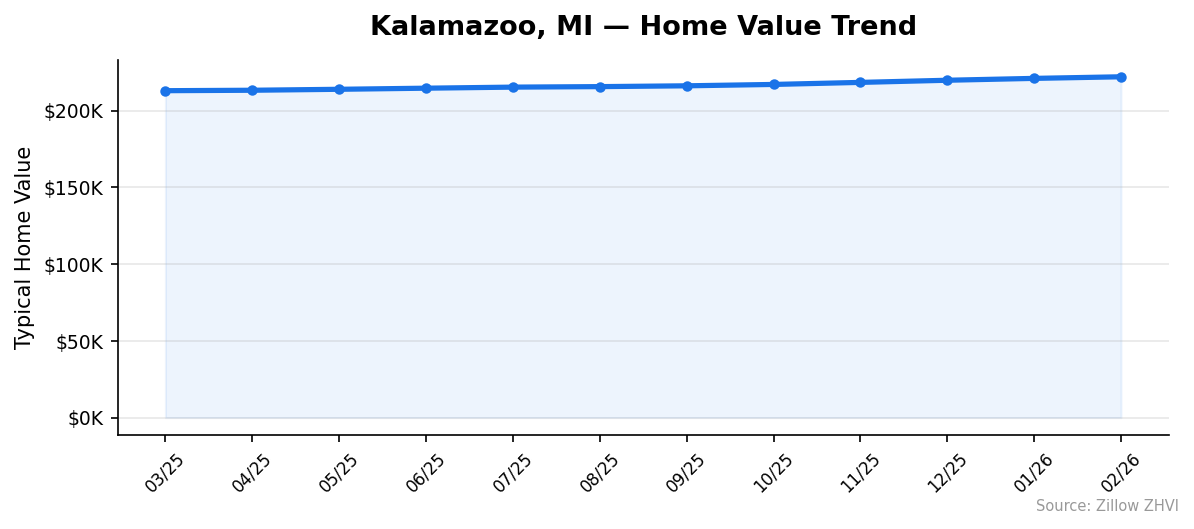
Prices have climbed every single month over the past year. No dips, no plateaus.
| Month | Typical Home Value |
|---|---|
| Feb 2026 | $221,999 |
| Jan 2026 | $220,961 |
| Dec 2025 | $219,742 |
| Nov 2025 | $218,347 |
| Oct 2025 | $217,016 |
| Sep 2025 | $216,121 |
| Aug 2025 | $215,594 |
| Jul 2025 | $215,266 |
| Jun 2025 | $214,572 |
| May 2025 | $213,856 |
| Apr 2025 | $213,230 |
| Mar 2025 | $212,942 |
Over 12 months, values rose from $212,942 to $221,999 — a $9,057 gain. The pace has actually accelerated. The last three months added $3,652, compared to about $2,700 in the three months before that.
That’s a 1.7% gain over the most recent quarter alone. Annualized, that pencils to roughly 7%. Momentum is on the uptick.
Is Kalamazoo a Good Place to Buy in 2026?
The data points to a mild seller’s market. Prices are rising, inventory turnover is reflected in the 4.3% annual appreciation, and the lower-priced ZIPs offer genuine affordability — rare in 2026.
Negatives: population isn’t growing. Flat demographics cap how fast home values can climb over the long haul. You’re buying stability, not speed.
If you want a sub-$200,000 home with rental math that works, ZIPs 49001 and 49007 are as good as it gets in a mid-sized Midwestern market. If you want the premium end, 49009 is the only ZIP above $300,000 — and its 23.3 price-to-rent ratio suggests buyers are paying a premium unsupported by local rental economics.
First-time buyers get the better deal here. Investors need to pick ZIPs carefully.
Kalamazoo Housing Market Outlook for 2026-2027
Momentum is positive. The 3-month trend shows values rising about $1,200 per month, faster than earlier in 2025. If the current pace continues through the spring buying season, Kalamazoo should cross $225,000 by mid-2026.
Whether that pace holds depends on two things the data can’t answer: mortgage rates and whether the population trend turns positive. Flat demographics cap how far prices can run. A sustained 4-5% annual gain would be a reasonable projection if the last 12 months are a guide.
A sudden reversal looks unlikely given the steady, dip-free climb visible in the monthly data. But don’t expect the kind of double-digit gains that hit Sun Belt cities in 2021-2022. Kalamazoo doesn’t work that way.
Similar Markets in MI
If Kalamazoo isn’t quite right, these Michigan cities offer different price points:
- Lansing — Michigan’s capital, a larger and slightly growing market for buyers who want more population density.
- Grand Rapids — the state’s second-largest city, with faster growth than Kalamazoo.
- Ann Arbor — a higher-priced college town for buyers willing to pay a premium.
- Jackson — a smaller market roughly halfway between Kalamazoo and Detroit.
- Detroit — the largest Michigan market, with a very different price profile.
Frequently Asked Questions
What is the average home price in Kalamazoo?
The typical Kalamazoo home is valued at $221,999 as of February 2026. That figure is the Zillow Home Value Index, which reflects the middle tier of the market rather than a simple average of sale prices.
Are home prices going up or down in Kalamazoo?
Up. Home values rose 4.3% in the 12 months ending February 2026. The monthly data shows no decline in any of the last 12 months, and the pace has accelerated slightly in the most recent quarter.
Is it cheaper to rent or buy in Kalamazoo?
It depends on the ZIP. In 49007 and 49001, the price-to-rent ratio is under 12 — strong buy territory. In 49009, the ratio is 23.3, which tilts toward renting. Citywide rent averages about $1,305 per month.
What is the most affordable neighborhood in Kalamazoo?
ZIP 49007 has the cheapest homes at $117,809 — roughly 47% below the citywide median. Rents there are $1,253 per month, making it the strongest rent-to-own math in the city.
Methodology
Home values are based on the Zillow Home Value Index (ZHVI), a smoothed measure of typical home values in the 35th to 65th percentile range. Rent estimates use the Zillow Observed Rent Index (ZORI). Population figures come from the U.S. Census Bureau Population Estimates Program (2020-2024 vintage). All datasets are publicly available. Housing data updated 2026-02-28.