Rancho Cucamonga Home Prices: $853K, Up 0.1% — 4 ZIPs Analyzed (2026)
$853,157. That’s what a typical home costs in Rancho Cucamonga right now. Prices barely moved over the past year — up just 0.1% — making this one of the flattest markets in the Inland Empire.
Quick answer: The average home price in Rancho Cucamonga, CA is $853,157 as of February 2026, up 0.1% year over year according to Zillow.
Current Home Prices in Rancho Cucamonga
The Rancho Cucamonga housing market sits in a holding pattern. Prices ticked up 0.1% compared to a year ago, which is essentially zero growth once you account for inflation.
| Metric | Value |
|---|---|
| Median Home Value | $853,157 |
| Year-over-Year Change | +0.1% |
| Lowest ZIP Median | $672,577 |
| Highest ZIP Median | $963,846 |
| Number of ZIP Codes | 4 |
| Metro Area | Riverside-San Bernardino-Ontario, CA |
The gap between the cheapest and most expensive neighborhoods is nearly $291,000. That spread means your budget determines not just the size of your home but which part of the city you can afford.
For context, $853K puts Rancho Cucamonga well above the national median but in line with many Southern California suburbs. The flat YoY number suggests the market has absorbed most of the pandemic-era gains and is now searching for direction.
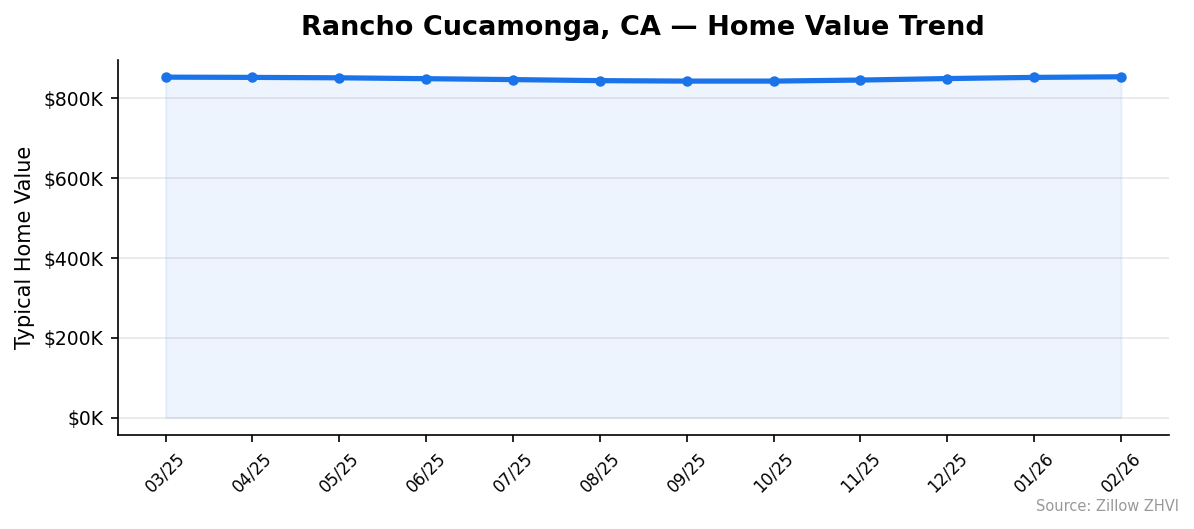
Buyers should note that while the annual change looks flat, the monthly data tells a more nuanced story. Prices dipped from spring through fall 2025, then recovered over the winter months. February 2026 marks the highest monthly value in the dataset.
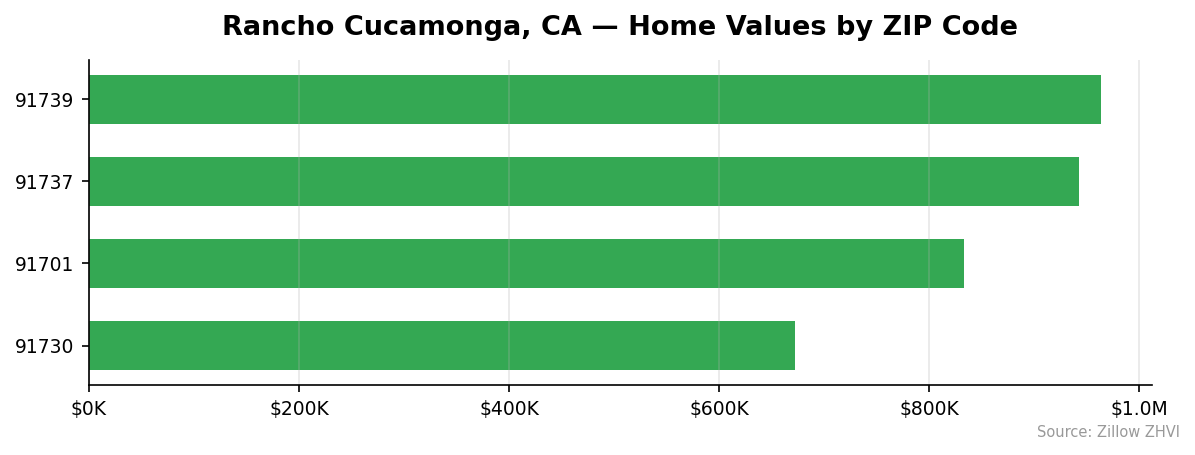
Rancho Cucamonga Home Prices by Neighborhood
Prices vary widely across Rancho Cucamonga’s four ZIP codes. The most expensive area costs 43% more than the most affordable one.
| ZIP Code | Median Home Value | Monthly Rent |
|---|---|---|
| 91739 | $963,846 | $2,751 |
| 91737 | $942,868 | $3,039 |
| 91701 | $833,338 | $2,729 |
| 91730 | $672,577 | $2,846 |
Most Expensive
91739 tops the list at $963,846, sitting 13% above the city median — yet its rent of $2,751 is actually below average, making it a neighborhood where owners have significantly more equity relative to what renters pay.
91737 follows closely at $942,868 and commands the highest rent in the city at $3,039 per month, suggesting strong demand from both buyers and renters.
Most Affordable
91730 is the entry point to Rancho Cucamonga homeownership at $672,577, about 21% below the city average. Interestingly, rents here run $2,846 — higher than two of the more expensive ZIP codes, which means landlords capture a larger share of home value.
91701 at $833,338 sits just below the city median and offers the lowest rent at $2,729, making it the most affordable ZIP for renters.
Rent vs Buy in Rancho Cucamonga
Renting is far cheaper than buying in Rancho Cucamonga right now. The math isn’t close.
| ZIP Code | Monthly Rent | Est. Mortgage Payment* |
|---|---|---|
| 91730 | $2,846 | ~$3,580 |
| 91701 | $2,729 | ~$4,435 |
| 91737 | $3,039 | ~$5,018 |
| 91739 | $2,751 | ~$5,130 |
*Estimated monthly principal and interest assuming 20% down, 7% rate. Does not include taxes, insurance, or HOA.
The average rent across all four ZIP codes is roughly $2,841 per month. A mortgage on the median-priced home ($853,157) with 20% down at a 7% interest rate runs about $4,525 per month in principal and interest alone. Add property taxes, insurance, and potential HOA fees, and the gap widens further.
That’s a $1,684 monthly premium to own instead of rent. Over a year, buying costs about $20,000 more than renting before you factor in equity, tax benefits, or appreciation.
With prices flat year over year, the appreciation argument for buying is weak in the short term. Renters get flexibility and lower costs. Buyers get equity and stability — but they pay a steep premium for it.
Population Growth and Migration
Rancho Cucamonga is growing, but slowly. The city added about 2,000 residents over four years.
| Year | Population |
|---|---|
| 2020 | 174,678 |
| 2021 | 175,361 |
| 2022 | 174,993 |
| 2023 | 175,395 |
| 2024 | 176,675 |
The 2024 population hit 176,675, a 1.1% increase from 2020. Growth wasn’t linear — the city actually lost residents in 2022 before bouncing back. The strongest single-year gain came between 2023 and 2024, when the city added 1,280 people.
How does that compare to other California cities?
| City | 2024 Population | 4-Year Growth |
|---|---|---|
| Bakersfield | 417,468 | 3.0% |
| Sacramento | 535,798 | 1.9% |
| San Diego | 1,404,452 | 1.4% |
| Fresno | 550,105 | 1.4% |
| Rancho Cucamonga | 176,675 | 1.1% |
| Oakland | 443,554 | 0.6% |
Rancho Cucamonga’s growth trails most large California cities. Bakersfield is adding residents nearly three times faster. This modest population growth limits demand-side pressure on home prices, which partly explains why values have gone flat.
Rancho Cucamonga Housing Market Trends
The 12-month trend reveals a U-shaped pattern. Prices peaked in spring 2025, dipped through early fall, and have climbed back.
| Month | Average Value | Low | High |
|---|---|---|---|
| Mar 2025 | $852,269 | $679,627 | $958,223 |
| Apr 2025 | $851,664 | $678,118 | $958,730 |
| May 2025 | $850,613 | $676,106 | $958,130 |
| Jun 2025 | $848,423 | $673,638 | $956,156 |
| Jul 2025 | $846,120 | $671,804 | $953,178 |
| Aug 2025 | $843,521 | $670,559 | $949,210 |
| Sep 2025 | $842,363 | $669,861 | $947,183 |
| Oct 2025 | $842,396 | $669,052 | $948,019 |
| Nov 2025 | $844,973 | $669,267 | $952,541 |
| Dec 2025 | $848,748 | $670,665 | $957,988 |
| Jan 2026 | $851,638 | $672,026 | $961,631 |
| Feb 2026 | $853,157 | $672,577 | $963,846 |
The bottom hit in September-October 2025, when values averaged $842,363. Since then, prices have climbed $10,794 — a 1.3% gain over five months. February 2026 set a new 12-month high.
The spread between the cheapest and most expensive ZIP codes stayed consistent throughout the year, ranging from $278,000 to $291,000. That tells you the entire market moved together rather than individual neighborhoods diverging.
Is Rancho Cucamonga a Good Place to Buy in 2026?
The data points to a balanced market. Neither buyers nor sellers have a clear upper hand.
For buyers, the case looks like this: prices are essentially flat year over year, meaning you’re not chasing a runaway market. The 0.1% annual gain is below inflation, so in real terms, homes are slightly cheaper than a year ago. You have time to be selective.
For sellers, the recent uptrend is encouraging. Five consecutive months of gains suggest the fall 2025 dip was a seasonal blip, not the start of a correction.
The rent-vs-buy gap is the biggest red flag. Paying $1,684 more per month to own only makes sense if you plan to stay long enough for appreciation and equity to close that gap. At 0.1% annual appreciation, that takes a long time.
If you’re buying to live in for 5+ years and can handle the monthly cost, the market isn’t working against you. If you’re looking for quick appreciation, the data doesn’t support that bet.
Rancho Cucamonga Housing Market Outlook for 2026-2027
The five-month uptrend from October 2025 through February 2026 suggests prices will continue rising modestly into spring and summer 2026. If the current pace of roughly $2,000-$3,000 per month continues, the median could push toward $860,000-$870,000 by mid-2026.
But last year’s pattern is worth watching. Prices peaked in March-April 2025 before sliding through fall. If the seasonal pattern repeats, the spring bounce may stall by summer.
The 3-month trend shows acceleration — January gained $2,890 and February gained $1,519. That’s mild momentum, not a breakout.
With population growth at just 1.1% over four years and rents already high relative to incomes, there’s limited fuel for a major price surge. Expect more of the same: slow, grinding movement in either direction.
Similar Markets in CA
If you’re exploring the Inland Empire and surrounding areas, here are comparable California markets:
- Fontana — A neighboring Inland Empire city that typically offers lower price points than Rancho Cucamonga.
- Riverside — The county seat, with a larger inventory and wider price range.
- Los Angeles — A much larger market where some neighborhoods overlap with Rancho Cucamonga pricing.
- Anaheim — Orange County option for buyers who want to stay in the greater LA area.
- Bakersfield — For buyers priced out of the Inland Empire, Bakersfield offers significantly lower home values.
Frequently Asked Questions
What is the average home price in Rancho Cucamonga?
The average home price in Rancho Cucamonga is $853,157 as of February 2026. Prices range from $672,577 in ZIP code 91730 to $963,846 in ZIP code 91739. The city sits within the Riverside-San Bernardino-Ontario metro area.
Are home prices going up or down in Rancho Cucamonga?
Prices are essentially flat, up just 0.1% year over year. Within that flat annual number, there was a mid-year dip — prices fell from $852,269 in March 2025 to $842,363 in September 2025, then recovered over the following five months. The recent short-term trend is upward.
Is it cheaper to rent or buy in Rancho Cucamonga?
Renting is significantly cheaper. The average monthly rent across Rancho Cucamonga is approximately $2,841. A mortgage on the median home with 20% down at 7% interest runs about $4,525 per month before taxes and insurance. That’s a $1,684 monthly gap favoring renters.
What is the most affordable neighborhood in Rancho Cucamonga?
ZIP code 91730 is the most affordable at $672,577, roughly 21% below the city median. Despite the lower purchase price, rents in 91730 run $2,846 per month — the second highest in the city — which makes it attractive for investment buyers as well.
Is Rancho Cucamonga growing or shrinking?
Rancho Cucamonga is growing slowly. The population reached 176,675 in 2024, up 1.1% from 174,678 in 2020. Growth dipped briefly in 2022 but picked up in 2023 and 2024. The pace trails faster-growing California cities like Bakersfield (3.0%) and Sacramento (1.9%).
Methodology
Home values are based on the Zillow Home Value Index (ZHVI), a smoothed measure of typical home values in the 35th to 65th percentile range. Rent estimates use the Zillow Observed Rent Index (ZORI). Population figures come from the U.S. Census Bureau Population Estimates Program (2020-2024 vintage). All datasets are publicly available. Housing data updated 2026-02-28.