Cincinnati Home Prices: $264K, Up 1.5% — 31 ZIPs Analyzed (2026)
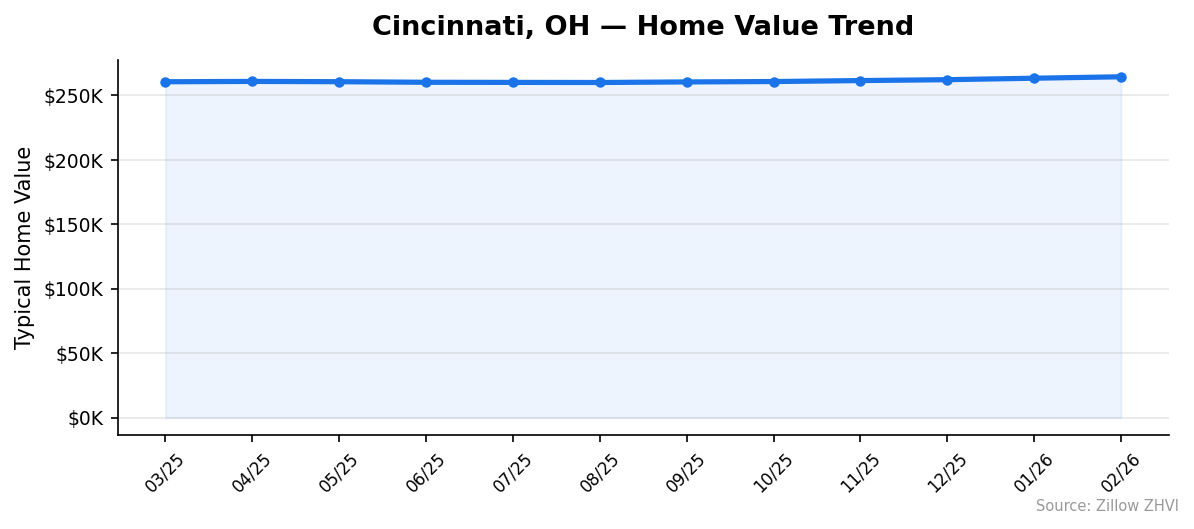
$264,487. That’s what a typical Cincinnati home is worth as of February 2026, up 1.5% from a year ago. Prices have inched up every single month since last September.
Quick answer: The average home price in Cincinnati, OH is $264,487 as of February 2026, up 1.5% year over year according to Zillow.
Current Home Prices in Cincinnati
The Cincinnati market is steady. Not hot, not cold. The 1.5% annual gain runs below national inflation, meaning real housing values are roughly flat. But the spread between cheap and expensive ZIPs is huge — more than 5x.
| Metric | Value |
|---|---|
| Median home value | $264,487 |
| Year-over-year change | +1.5% |
| Cheapest ZIP | $113,360 (45225) |
| Most expensive ZIP | $603,691 (45208) |
| ZIP codes tracked | 31 |
| Data through | February 2026 |
For context, Cincinnati sits well below the national median home price. A $264K home here puts you in the 35th–65th percentile of typical homes — middle-of-the-market stock, not luxury, not distressed.
The price floor matters. ZIPs in the low-$100Ks still exist inside city limits, which is rare for a metro of this size. You can buy a house in Cincinnati for less than a year of tuition at some private universities.
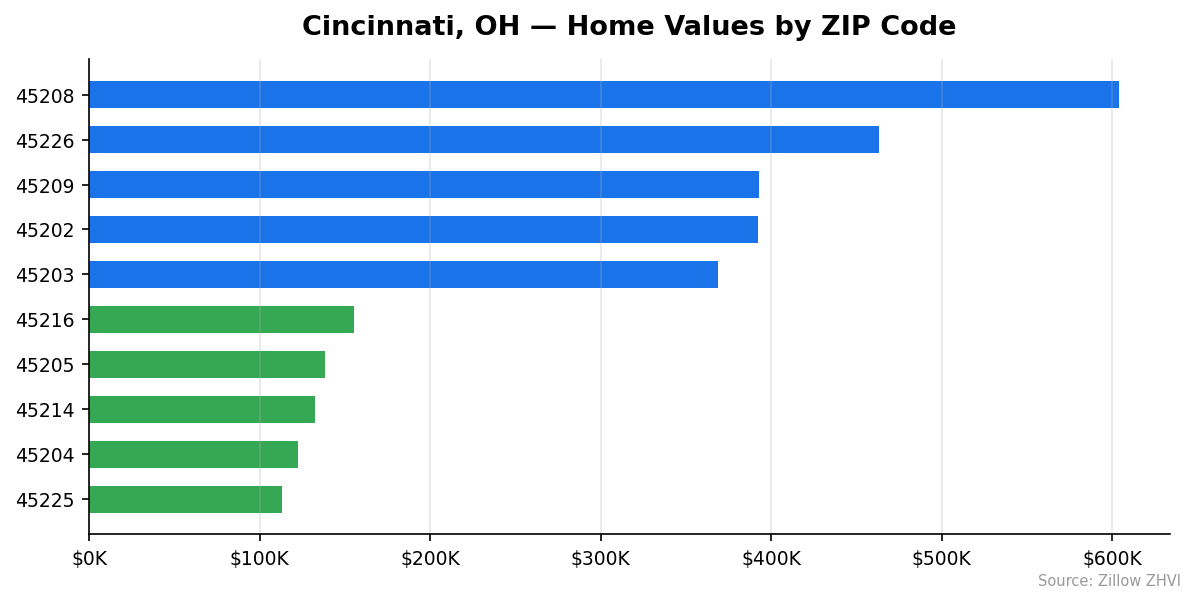
The ceiling tells the other side of the story. East-side and inner-ring suburb ZIPs push past $400K and $500K. Hyde Park (45208) cracks $600K — more than 5x the cheapest neighborhood.
Cincinnati Home Prices by Neighborhood
| ZIP | Median Value | Rent (ZORI) |
|---|---|---|
| 45208 | $603,691 | $1,503 |
| 45226 | $463,045 | $1,580 |
| 45209 | $392,822 | $1,528 |
| 45202 | $392,124 | $1,601 |
| 45203 | $368,936 | — |
| 45255 | $347,658 | $1,694 |
| 45233 | $340,795 | $1,148 |
| 45220 | $327,025 | $1,329 |
| 45245 | $323,260 | $1,583 |
| 45230 | $303,751 | $1,318 |
| 45252 | $301,252 | — |
| 45213 | $290,795 | $1,429 |
| 45227 | $277,158 | $1,641 |
| 45219 | $264,422 | $1,651 |
| 45206 | $254,638 | $1,542 |
| 45229 | $245,404 | $1,322 |
| 45251 | $219,164 | $1,527 |
| 45223 | $217,180 | $1,223 |
| 45238 | $215,873 | $1,143 |
| 45207 | $211,396 | $1,653 |
| 45231 | $210,151 | $1,530 |
| 45224 | $206,739 | $1,207 |
| 45239 | $203,914 | $1,319 |
| 45237 | $195,156 | $1,159 |
| 45211 | $192,283 | $1,155 |
| 45232 | $168,743 | — |
| 45216 | $155,036 | — |
| 45205 | $138,181 | $1,323 |
| 45214 | $132,452 | $1,182 |
| 45204 | $122,699 | $1,283 |
| 45225 | $113,360 | — |
Most Expensive
45208 ($603,691) — Hyde Park territory, more than 2x the city median and the only ZIP above the $600K mark. Rents here are mid-pack at $1,503, suggesting buyers pay a premium for the neighborhood, not the cash flow.
45226 ($463,045) — Linwood/Mt. Lookout, the second-priciest ZIP. Rent runs $1,580, putting price-to-rent at 24x — high enough that owning is a long-term play, not a yield play.
45209 ($392,822) — Norwood-adjacent. Crosses the $390K line with rents near $1,528, mirroring the pattern: high prices, moderate rents.
Most Affordable
45225 ($113,360) — The cheapest ZIP in the city, at less than half the metro median. South Fairmount sits well under the $150K mark.
45204 ($122,699) — Lower Price Hill area. You can rent here for $1,283 — almost the same as the cheaper East-side suburbs, despite a price tag a third as large.
45214 ($132,452) — West End. At $132K with rent around $1,182, the price-to-rent ratio falls to roughly 9x — the strongest cash-flow math in the city for landlords.
Rent vs Buy in Cincinnati
The average ZIP-level rent in Cincinnati lands around $1,400 a month based on ZORI data. The cheapest rents (45233, 45238) sit near $1,143–$1,148. The priciest (45255, 45207) push past $1,650.
Now the buying math. A median-priced $264,487 home with 20% down ($52,897) leaves a $211,590 mortgage. At a 7% rate over 30 years, that’s about $1,408 a month for principal and interest alone. Add property taxes (Hamilton County averages roughly 1.7% of assessed value, so $375/month) and homeowners insurance ($130/month), and you land near $1,910 a month.
| Cost | Renting | Buying (median) |
|---|---|---|
| Monthly housing | ~$1,400 | ~$1,910 |
| Down payment | $0 | $52,897 |
| Maintenance/repairs | $0 | ~$220/mo (1% rule) |
Renting is cheaper by roughly $500 a month before maintenance, and roughly $700 cheaper after. The trade-off: renters build no equity, and at 1.5% annual price appreciation, a Cincinnati owner gains about $4,000 a year in home value — slow but real.
The math flips in the cheap ZIPs. A $122,699 home in 45204 carries a mortgage of about $650 P&I, and rents in the same ZIP run $1,283. There, buying beats renting by hundreds a month.
Population Growth and Migration
Cincinnati added 5,311 residents from 2020 to 2024 — a 1.7% gain. That’s slow growth, but it’s growth. The city dipped in 2021 (likely pandemic effects), then climbed for three straight years.
| Year | Population |
|---|---|
| 2020 | 309,604 |
| 2021 | 308,701 |
| 2022 | 310,211 |
| 2023 | 312,703 |
| 2024 | 314,915 |
Compared to other Ohio cities, Cincinnati holds up well:
| City | 2024 Population | 4-year Growth |
|---|---|---|
| Columbus | 933,263 | +3.0% |
| Cincinnati | 314,915 | +1.7% |
| Lorain | 65,751 | +0.8% |
| Hamilton | 63,953 | +0.8% |
| Akron | 189,664 | -0.3% |
| Dayton | 136,346 | -0.9% |
Columbus is pulling ahead of the rest of the state. Cincinnati ranks second for growth among major Ohio cities. Akron and Dayton are shrinking. That divergence matters for housing — cities losing residents face downward price pressure that Cincinnati doesn’t.
A 1.7% population gain combined with a 1.5% home price gain suggests demand is roughly tracking supply. No boom, no bust.
Cincinnati Housing Market Trends
Twelve months of price data show a market that bottomed in late summer 2025 and has climbed steadily since.
| Month | Median Value | Min ZIP | Max ZIP |
|---|---|---|---|
| Feb 2026 | $264,487 | $113,360 | $603,691 |
| Jan 2026 | $263,382 | $112,475 | $600,794 |
| Dec 2025 | $262,237 | $110,910 | $598,688 |
| Nov 2025 | $261,549 | $110,430 | $597,312 |
| Oct 2025 | $260,795 | $109,788 | $594,212 |
| Sep 2025 | $260,493 | $109,548 | $590,611 |
| Aug 2025 | $260,059 | $109,211 | $586,534 |
| Jul 2025 | $260,132 | $109,997 | $584,571 |
| Jun 2025 | $260,230 | $111,233 | $583,143 |
| May 2025 | $260,671 | $112,176 | $582,787 |
| Apr 2025 | $260,896 | $112,437 | $581,939 |
| Mar 2025 | $260,630 | $112,547 | $580,096 |
The local low was August 2025 at $260,059. Since then, prices have added $4,428 — about 1.7% in six months, a pace faster than the 12-month rate. The high-end ZIPs are pulling the average up: the max ZIP value rose from $580K to $604K over the year, a 4% gain, while the cheapest ZIP barely moved.
Is Cincinnati a Good Place to Buy in 2026?
This looks like a balanced market leaning slightly toward sellers. Prices are climbing for six straight months, but the pace is gentle — under 2% annually. Inventory pressure isn’t extreme.
The buyer’s case: prices are still well below national averages, the city is growing (modestly), and Cincinnati’s price floor in the low-$100Ks is genuinely rare for a metro of 2 million people. Even the median home costs less than a starter home in many coastal markets.
The seller’s case: rising prices, growing population, no obvious slowdown signal. If you bought before 2022, you’re sitting on equity gains.
For investors, the cheap West-side ZIPs (45204, 45214, 45225) offer the strongest rent-to-price ratios, with rents at $1,200–$1,300 against home values under $140K. That math doesn’t exist in most U.S. cities anymore.
For owner-occupants on a budget, Cincinnati remains one of the more accessible mid-sized metros in the country.
Cincinnati Housing Market Outlook for 2026-2027
The 3-month trend points up. Prices added $2,250 between December and February — about 0.85% in two months. If the current pace continues, Cincinnati would cross $270,000 by mid-2026.
The 12-month direction is unambiguous. Every recent month is higher than the one before. There’s no sign of a top.
That said, the gain rate is decelerating compared to the 2021–2022 boom years, and a 1.5% annual increase barely keeps up with inflation. Don’t expect double-digit appreciation.
If population growth continues at 1.7% per four years and mortgage rates stay near current levels, the most likely scenario is more of the same: low-single-digit price gains, no crash, no boom. Buyers waiting for a meaningful correction probably won’t get one.
Similar Markets in OH
- Columbus — Ohio’s growth leader, with faster population gains than Cincinnati but typically higher prices.
- Cleveland — Another major Ohio metro worth comparing if you’re weighing the state’s largest cities.
- Dayton — Cheaper than Cincinnati, but the population is shrinking, which works against long-term price growth.
- Hamilton — Cincinnati’s neighbor in Butler County, often a budget alternative for Cincinnati commuters.
- Toledo — Lower prices than Cincinnati if affordability is the priority over job market depth.
Frequently Asked Questions
What is the average home price in Cincinnati?
The average home price in Cincinnati is $264,487 as of February 2026. That figure represents the Zillow Home Value Index across 31 ZIP codes inside the city, covering homes in the 35th to 65th percentile range.
Are home prices going up or down in Cincinnati?
Prices are up 1.5% year over year. More importantly, the median has climbed every month since September 2025, adding about $4,400 over six months — a pace slightly faster than the annual figure suggests.
Is it cheaper to rent or buy in Cincinnati?
Renting is cheaper. The average rent runs about $1,400, while buying the median $264,487 home with 20% down works out to roughly $1,910 a month after taxes and insurance — a $500 monthly gap before maintenance costs. The math reverses in cheaper ZIPs like 45204 and 45214.
What is the most affordable neighborhood in Cincinnati?
ZIP 45225 (South Fairmount area) is the cheapest at $113,360 — less than half the city median. ZIPs 45204 ($122,699) and 45214 ($132,452) round out the three most affordable areas, all on the West Side.
Methodology
Home values are based on the Zillow Home Value Index (ZHVI), a smoothed measure of typical home values in the 35th to 65th percentile range. Rent estimates use the Zillow Observed Rent Index (ZORI). Population figures come from the U.S. Census Bureau Population Estimates Program (2020-2024 vintage). All datasets are publicly available. Housing data updated 2026-02-28.