Temecula Home Prices: $987K, Down 1.7% — 3 ZIPs Analyzed (2026)
Can you still afford a house in Temecula? The median home value sits at $986,732 as of February 2026 — just barely under the million-dollar mark. Prices have slipped 1.7% over the past year, a modest pullback after the city crossed into seven-figure territory in early 2025.
Quick answer: The average home price in Temecula, CA is $986,732 as of February 2026, down 1.7% year over year according to Zillow.
Current Home Prices in Temecula
Here’s a snapshot of where the Temecula housing market stands right now:
| Metric | Value |
|---|---|
| Median Home Value | $986,732 |
| Year-over-Year Change | -1.7% |
| Lowest ZIP Median | $736,557 |
| Highest ZIP Median | $1,460,993 |
| Number of ZIP Codes | 3 |
| Data as of | February 2026 |
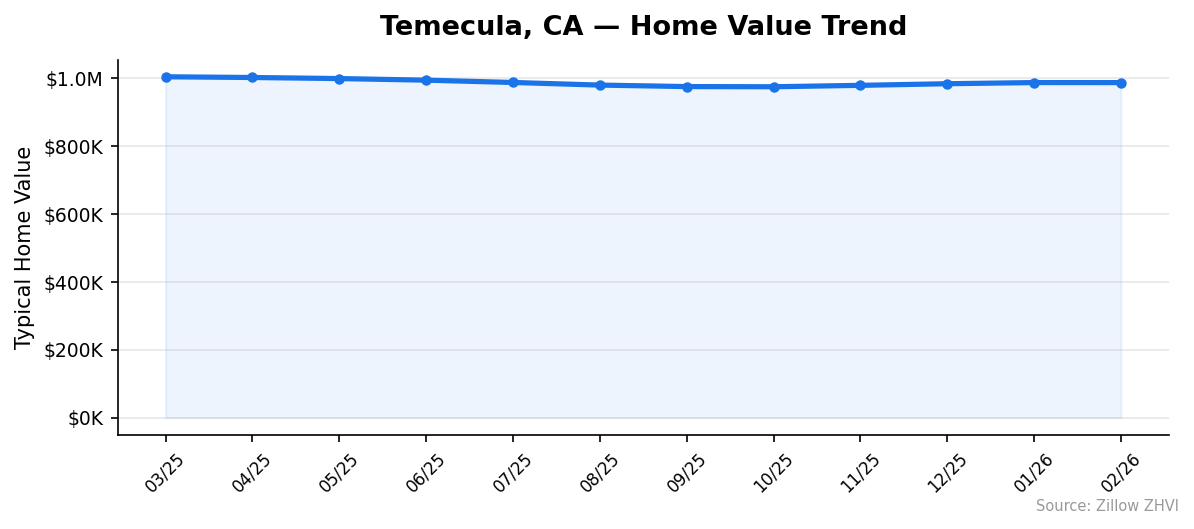
The 1.7% annual decline may not sound dramatic, but it represents a shift. A year ago, in March 2025, the average sat at $1,003,859. That was the recent peak. Since then, prices have drifted steadily lower through summer and fall before stabilizing in the winter months.
The gap between the cheapest and most expensive neighborhoods is enormous. The least expensive ZIP comes in at $736,557 while the priciest tops $1.46 million. That $724,000 spread means your experience of the Temecula market depends heavily on which side of town you’re shopping.
For context, the Riverside-San Bernardino-Ontario metro area — which includes Temecula — is one of the larger housing markets in Southern California. Temecula sits at the premium end of that metro.
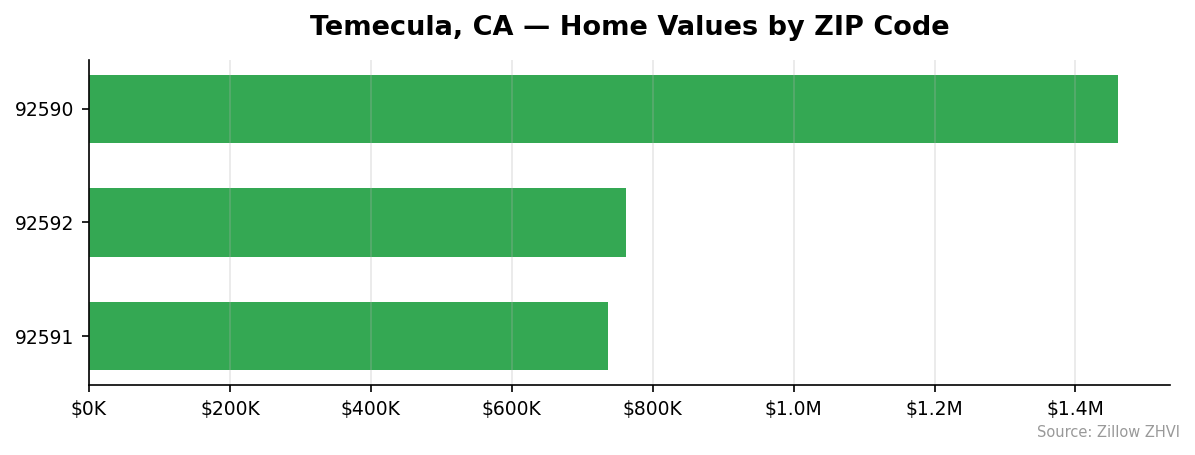
Temecula Home Prices by Neighborhood
All three Temecula ZIP codes show significant price variation:
| ZIP Code | Median Home Value | Median Rent |
|---|---|---|
| 92590 | $1,460,993 | $2,376/mo |
| 92592 | $762,646 | $3,119/mo |
| 92591 | $736,557 | $2,602/mo |
Most Expensive
92590 stands out at $1,460,993 — nearly double the city average. This ZIP runs almost $700,000 above the next most expensive neighborhood. Interestingly, it has the lowest rent of the three ZIPs at $2,376 per month, which suggests the high home values are driven by owner-occupied properties rather than rental demand.
Most Affordable
92591 is the entry point into Temecula at $736,557, about 25% below the city-wide median. Rent here runs $2,602 per month. If you’re trying to buy in Temecula without cracking a million dollars, this ZIP and neighboring 92592 ($762,646) are your best options. Both sit in a similar range and offer a path into the market for buyers priced out of the 92590 area.
One oddity in the data: 92592 has the highest rents ($3,119/mo) despite not having the highest home values. That creates a worse rent-to-price ratio for tenants in that ZIP.
Rent vs Buy in Temecula
The math strongly favors renting right now.
Average rents across Temecula’s three ZIP codes come out to roughly $2,699 per month. Here’s how that compares to buying:
| Cost | Monthly Amount |
|---|---|
| Average Rent | ~$2,699 |
| Mortgage (20% down, 7%, 30yr) | ~$5,253 |
| Difference | ~$2,554 |
A buyer putting 20% down on the median $986,732 home would finance about $789,386. At a 7% rate over 30 years, that’s approximately $5,253 per month in principal and interest alone — before property taxes, insurance, or maintenance.
That means buying costs nearly double what renting does on a pure monthly payment basis. The rent-to-mortgage gap is about $2,554 per month, or over $30,000 per year.
This doesn’t mean buying is always the wrong call. Homeowners build equity, and mortgage payments are fixed while rents rise. But the upfront cost difference is steep. Buyers need to plan for the long term to make the numbers work.
Population Growth and Migration
Temecula’s population reached 112,431 in 2024, up from 110,084 in 2020. That’s a 2.1% increase over four years.
| Year | Population |
|---|---|
| 2020 | 110,084 |
| 2021 | 110,948 |
| 2022 | 110,952 |
| 2023 | 111,413 |
| 2024 | 112,431 |
Growth was nearly flat between 2021 and 2022, then picked up in 2023 and 2024. The city added about 1,000 residents in the most recent year.
Here’s how Temecula’s growth rate compares to other California cities:
| City | 2024 Population | 4-Year Growth |
|---|---|---|
| Bakersfield | 417,468 | 3.0% |
| Temecula | 112,431 | 2.1% |
| Sacramento | 535,798 | 1.9% |
| San Diego | 1,404,452 | 1.4% |
| Fresno | 550,105 | 1.4% |
| Oakland | 443,554 | 0.6% |
Temecula is growing faster than most major California cities. Only Bakersfield outpaces it. That steady population growth puts upward pressure on housing demand, which partially explains why prices remain near $1 million despite the recent dip.
Temecula Housing Market Trends
The 12-month price history tells a clear story — a peak in spring 2025 followed by a slow decline:
| Month | Average Value | Low | High |
|---|---|---|---|
| Mar 2025 | $1,003,859 | $752,416 | $1,485,281 |
| Apr 2025 | $1,001,775 | $750,701 | $1,482,257 |
| May 2025 | $998,617 | $748,198 | $1,477,441 |
| Jun 2025 | $993,922 | $745,227 | $1,468,675 |
| Jul 2025 | $987,139 | $740,566 | $1,457,211 |
| Aug 2025 | $979,405 | $735,465 | $1,443,751 |
| Sep 2025 | $975,035 | $732,059 | $1,437,221 |
| Oct 2025 | $974,503 | $730,983 | $1,437,284 |
| Nov 2025 | $978,643 | $732,238 | $1,446,741 |
| Dec 2025 | $983,435 | $734,314 | $1,456,310 |
| Jan 2026 | $986,801 | $735,967 | $1,462,693 |
| Feb 2026 | $986,732 | $736,557 | $1,460,993 |
Prices dropped from $1,003,859 in March 2025 to a low of $974,503 in October — a 2.9% decline over seven months. Then the trend reversed. November through January showed steady recovery, gaining about $12,000 in three months. February was essentially flat, ticking down just $69 from January.
The bottom and top of the market moved in sync. The cheapest ZIP dropped from $752,416 to $730,983 and back to $736,557. The most expensive went from $1,485,281 down to $1,437,221 and back to $1,460,993.
Is Temecula a Good Place to Buy in 2026?
The data points to a market in transition. Prices are off their peak but appear to have found a floor. The 1.7% year-over-year decline puts buyers in a stronger position than they had in spring 2025.
A few things work in buyers’ favor. Prices have stabilized after months of decline. The year-over-year change is negative, meaning you’re not chasing a rapidly appreciating market. And with three distinct price tiers across the ZIP codes, there are options whether your budget is $700K or $1.4 million.
Working against buyers: this is still a near-million-dollar market. Monthly mortgage payments run well above rents. And population growth — 2.1% over four years — keeps demand steady.
For buyers with a long time horizon and a budget above $700K, the current flat pricing creates a reasonable entry window. For those on tighter budgets, renting remains the more practical option.
Temecula Housing Market Outlook for 2026-2027
The three-month trend from November 2025 through January 2026 showed a recovery of about $12,000, or roughly 1.3%. February flattened out, suggesting the rebound may be losing momentum.
If the current pace continues, prices are likely to hover in the $980K-$1M range through spring and summer 2026. The seasonal pattern visible in the data — a spring peak followed by a fall dip — could repeat, with prices pushing back toward $1 million by mid-year before softening again in autumn.
The flat month-over-month change between January and February suggests the market is searching for direction. Without a clear catalyst in either direction, a sideways market through 2026 looks like the most probable outcome based on the trend data.
Similar Markets in CA
If you’re looking at Temecula, these California cities offer different price points:
- Riverside — Temecula’s neighbor in the Inland Empire, typically at a lower price point.
- San Diego — A larger coastal market about an hour south with a different buyer profile.
- Fontana — Another Inland Empire option for buyers looking at more affordable alternatives.
- Bakersfield — Significantly lower prices and the fastest-growing major city on this list at 3.0% population growth.
- Chula Vista — South San Diego County with a suburban feel similar to Temecula.
Frequently Asked Questions
What is the average home price in Temecula?
The average home price in Temecula is $986,732 as of February 2026. Prices range from $736,557 in ZIP code 92591 to $1,460,993 in ZIP code 92590. The city-wide median sits just below the $1 million mark.
Are home prices going up or down in Temecula?
Prices are down 1.7% year over year. The recent peak was $1,003,859 in March 2025, and values declined through October before partially recovering. The market appears to be stabilizing near current levels.
Is it cheaper to rent or buy in Temecula?
Renting is considerably cheaper. Average rent across Temecula runs about $2,699 per month, while a mortgage on the median home (20% down, 7% rate) costs roughly $5,253 per month. That’s a gap of over $2,500 per month before taxes and insurance.
What is the most affordable neighborhood in Temecula?
ZIP code 92591 is the most affordable at $736,557, about 25% below the city average. Neighboring 92592 is close behind at $762,646. Both offer a way into the Temecula market without crossing the million-dollar threshold.
Is Temecula growing or shrinking?
Temecula is growing. The population increased from 110,084 in 2020 to 112,431 in 2024, a 2.1% gain. That growth rate outpaces Sacramento, San Diego, Fresno, and Oakland over the same period.
Methodology
Home values are based on the Zillow Home Value Index (ZHVI), a smoothed measure of typical home values in the 35th to 65th percentile range. Rent estimates use the Zillow Observed Rent Index (ZORI). Population figures come from the U.S. Census Bureau Population Estimates Program (2020-2024 vintage). All datasets are publicly available. Housing data updated 2026-02-28.