Yonkers Home Prices: $701K, Up 5.5% — 6 ZIPs Analyzed (2026)
$701,469. That’s what a typical home costs in Yonkers right now — and the number keeps climbing.
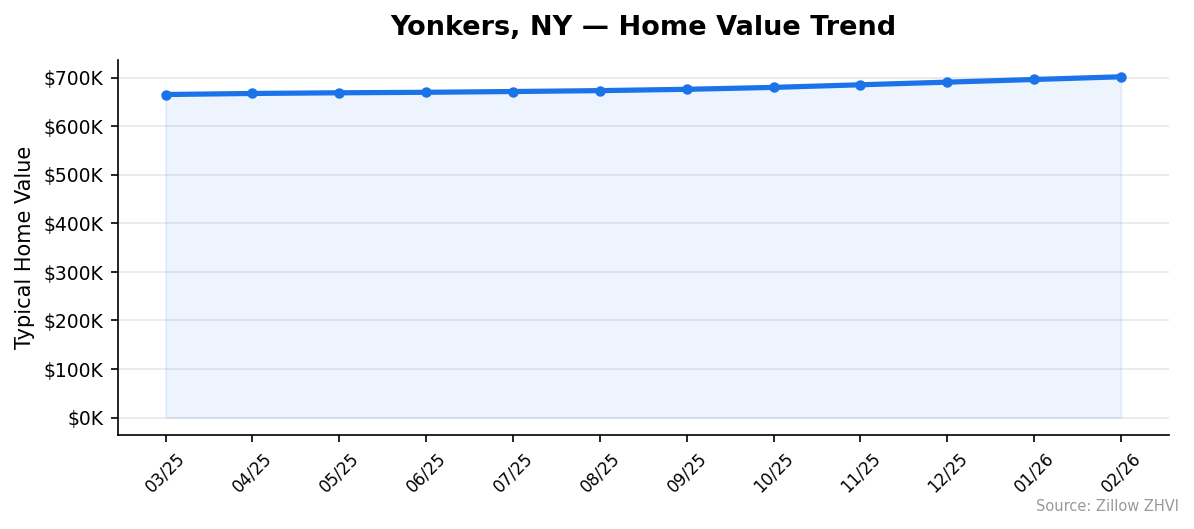
The city’s median home value hit $701,469 in February 2026, a 5.5% increase from a year ago. Every month over the past twelve showed gains. But not every neighborhood moved equally. The gap between the cheapest and priciest ZIP code is $341,464.
Quick answer: The average home price in Yonkers, NY is $701,469 as of February 2026, up 5.5% year over year according to Zillow.
Current Home Prices in Yonkers
| Metric | Value |
|---|---|
| Median Home Value | $701,469 |
| Year-over-Year Change | +5.5% |
| Lowest ZIP Median | $599,155 |
| Highest ZIP Median | $940,619 |
| ZIP Codes Tracked | 6 |
| Data as of | February 2026 |
Yonkers sits inside the New York-Newark-Jersey City metro area, one of the most expensive housing markets in the country. The 5.5% annual gain translates to roughly $36,500 in added home value over the past year alone.
The price floor in Yonkers starts just under $600,000, which puts even the most affordable neighborhoods well above the national median. The ceiling pushes past $940,000. That’s a wide spread for a city that covers just 20 square miles.
The steady climb hasn’t paused. From March 2025 through February 2026, the citywide median rose every single month. The pace accelerated toward the end of that period — the jump from January to February 2026 was $5,548, one of the larger month-over-month increases in the twelve-month window.
Yonkers Home Prices by Neighborhood
| ZIP Code | Median Home Value | Median Rent |
|---|---|---|
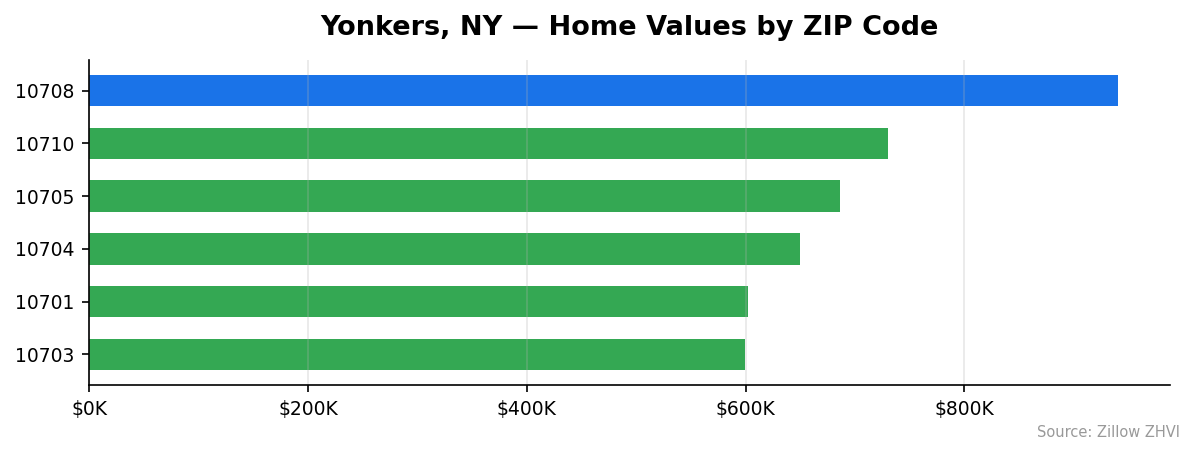
| 10703 | $599,155 | $2,934 |
| 10701 | $602,610 | $2,664 |
| 10704 | $649,847 | $2,630 |
| 10705 | $686,458 | $2,595 |
| 10710 | $730,125 | N/A |
| 10708 | $940,619 | $2,549 |
Most Expensive ZIPs
10708 leads at $940,619, a full 34% above the citywide median — and oddly enough, it has the lowest rent of any ZIP with rent data at $2,549. 10710 comes in second at $730,125, the only ZIP without available rent data. 10705 rounds out the top three at $686,458 with rent at $2,595.
Most Affordable ZIPs
10703 is the cheapest entry point at $599,155, though its rent is the highest in the city at $2,934. 10701 is nearly identical in home value at $602,610 with lower rent at $2,664. 10704 sits in the middle at $649,847 with rent of $2,630.
An interesting pattern emerges: the cheapest ZIPs to buy tend to have the highest rents, while the most expensive ZIP to buy has the lowest rent. That gap suggests strong rental demand in the more affordable areas.
Rent vs Buy in Yonkers
The average rent across Yonkers ZIPs with available data runs about $2,674 per month.
| Cost | Monthly |
|---|---|
| Average Rent (ZORI) | $2,674 |
| Estimated Mortgage (20% down, 7%) | ~$3,730 |
| Monthly Difference | ~$1,056 |
A buyer putting 20% down on the $701,469 median home would finance roughly $561,000. At a 7% rate on a 30-year mortgage, that’s about $3,730 per month in principal and interest — before property taxes, insurance, and maintenance.
Renting saves you roughly $1,056 per month in cash flow. That’s $12,672 a year. Of course, the mortgage payment builds equity, and Yonkers values rose $36,500 over the past year. If that pace holds, the equity gain outweighs the cash flow penalty. But 5.5% annual appreciation is not guaranteed to continue.
Property taxes in Westchester County are among the highest in the nation, which widens the gap between renting and owning even further. Factor in taxes, and the true monthly cost of ownership climbs well past $4,000 for a median-priced home.
Population Growth and Migration
Yonkers is flat. The city’s population was 211,040 in 2024, barely above its 2020 count of 210,995. That’s a 0.0% change over four years.
| Year | Population |
|---|---|
| 2020 | 210,995 |
| 2021 | 210,104 |
| 2022 | 208,768 |
| 2023 | 208,922 |
| 2024 | 211,040 |
The trend shows a dip in 2021 and 2022 — losing over 2,200 residents — followed by a recovery in 2023 and 2024 that brought the count back to where it started. This is a city that shrank and then bounced back, not one that’s growing.
Compare that to neighboring cities:
| City | 2024 Population | 4-Year Growth |
|---|---|---|
| New Rochelle | 85,512 | +6.6% |
| White Plains | 62,561 | +5.0% |
| Albany | 101,317 | +2.7% |
| Schenectady | 69,495 | +1.7% |
| Buffalo | 276,617 | -0.3% |
New Rochelle and White Plains, both smaller Westchester cities, are growing at 5-7%. Yonkers is not keeping pace with its neighbors. Flat population combined with rising prices suggests the demand is coming from buyers outside the city — likely priced out of Manhattan and the Bronx — rather than from organic local growth.
Yonkers Housing Market Trends
| Month | Median Value | Month-over-Month Change |
|---|---|---|
| Feb 2026 | $701,469 | +$5,548 |
| Jan 2026 | $695,921 | +$5,504 |
| Dec 2025 | $690,417 | +$5,375 |
| Nov 2025 | $685,042 | +$5,402 |
| Oct 2025 | $679,640 | +$3,937 |
| Sep 2025 | $675,703 | +$2,727 |
| Aug 2025 | $672,976 | +$1,821 |
| Jul 2025 | $671,155 | +$1,604 |
| Jun 2025 | $669,551 | +$1,018 |
| May 2025 | $668,533 | +$1,373 |
| Apr 2025 | $667,160 | +$2,171 |
| Mar 2025 | $664,989 | — |
The acceleration is clear. Monthly gains started under $1,500 in mid-2025 and have climbed to over $5,000 by early 2026. The total increase from March 2025 to February 2026 was $36,480 — an average of $3,316 per month.
The second half of the period moved noticeably faster than the first. From March to August 2025, the city added about $8,000 in value. From September 2025 to February 2026, it added $25,800. That’s a sharp change in momentum.
Is Yonkers a Good Place to Buy in 2026?
The data points to a seller’s market. Prices are rising, acceleration is building, and population stagnation means supply isn’t expanding from new construction pressure.
For buyers, the math is tough. A median home at $701K requires roughly $140,000 for a 20% down payment. Monthly costs with taxes and insurance push past $4,500. You need a household income north of $150,000 to buy comfortably.
The upside: Yonkers remains cheaper than much of Westchester County, and it has Metro-North access to Manhattan. The 5.5% annual gain rewards those who can get in. The downside: flat population growth hints at limited long-term demand expansion, and high property taxes eat into returns.
If you’re buying to live in for 5+ years and can handle the monthly cost, the trend supports it. If you’re speculating on short-term gains, the accelerating prices look promising but carry risk if broader metro demand softens.
Yonkers Housing Market Outlook for 2026-2027
The 3-month trend is strong. From December 2025 through February 2026, the median rose about $5,500 each month. If that pace holds through mid-2026, expect values near $720,000 by summer.
The acceleration pattern — slow gains in spring 2025, faster gains in fall and winter — could signal a seasonal cycle or a real shift in demand. Watch the March-May 2026 numbers. If monthly gains stay above $5,000, the annual appreciation rate could push past 6%.
A slowdown is also possible. Interest rates, metro-area job losses, or a correction in the broader New York market could all dampen momentum. The current trajectory is upward, but twelve months of data is a short window.
Similar Markets in NY
- New York — The city next door and the main reason Yonkers attracts buyers looking for relatively lower prices.
- New Rochelle — Growing at 6.6% population and also in Westchester, worth comparing directly.
- Mount Vernon — Another southern Westchester city bordering Yonkers.
- Albany — Buyers who want New York state without New York metro prices might look upstate.
- Buffalo — For those willing to leave the metro entirely, Buffalo offers a dramatically different price point.
Frequently Asked Questions
What is the average home price in Yonkers?
The average home price in Yonkers is $701,469 as of February 2026. That’s the citywide median across six ZIP codes. Individual neighborhoods range from $599,155 in ZIP 10703 to $940,619 in ZIP 10708.
Are home prices going up or down in Yonkers?
Prices are going up. Yonkers home values increased 5.5% year over year through February 2026. The gains have been accelerating — monthly increases more than tripled from mid-2025 to early 2026.
Is it cheaper to rent or buy in Yonkers?
Renting is cheaper on a monthly basis. Average rent is about $2,674, while a mortgage on the median home runs roughly $3,730 before taxes and insurance. However, buyers gain equity, and home values rose $36,500 over the past year.
What is the most affordable neighborhood in Yonkers?
ZIP code 10703 has the lowest median home value at $599,155, followed closely by 10701 at $602,610. Both are roughly $100,000 below the citywide median and represent the most accessible entry points for buyers.
Methodology
Home values are based on the Zillow Home Value Index (ZHVI), a smoothed measure of typical home values in the 35th to 65th percentile range. Rent estimates use the Zillow Observed Rent Index (ZORI). Population figures come from the U.S. Census Bureau Population Estimates Program (2020-2024 vintage). All datasets are publicly available. Housing data updated 2026-02-28.