Plainfield Home Prices: $435K, Up 2.8% — 3 ZIPs Analyzed (2026)
$434,730. That’s what a typical home costs in Plainfield right now — and that number has been climbing every single month for the past year.
Quick answer: The average home price in Plainfield, IL is $434,730 as of February 2026, up 2.8% year over year according to Zillow.
Current Home Prices in Plainfield
Plainfield sits in the Chicago-Naperville-Elgin metro, one of the largest housing markets in the Midwest. Here’s where prices stand today.
| Metric | Value |
|---|---|
| Median Home Price | $434,730 |
| Year-over-Year Change | +2.8% |
| Lowest ZIP Value | $379,418 |
| Highest ZIP Value | $540,818 |
| ZIP Codes Tracked | 3 |
| Data as of | February 2026 |
A 2.8% annual gain sounds modest, but on a $435K home, that’s over $12,000 in added value in one year. Plainfield homeowners aren’t seeing the explosive appreciation that marked 2021-2022, but they’re seeing steady, consistent growth.
The spread between the cheapest and most expensive ZIP codes is $161,400. That’s a meaningful gap for a single suburb — your neighborhood choice matters a lot here.
For buyers, the math is straightforward. A 20% down payment on the median home runs about $86,946. At a 7% mortgage rate, you’re looking at roughly $2,315 per month in principal and interest alone. Add Will County property taxes (among the highest in the nation) and insurance, and you’re closer to $3,000 or more per month.
Plainfield Home Prices by Neighborhood
Three ZIP codes cover Plainfield. The price differences between them are significant.
| ZIP Code | Typical Home Value | vs. City Median |
|---|---|---|
| 60585 | $540,818 | +$106,088 |
| 60586 | $383,955 | -$50,775 |
| 60544 | $379,418 | -$55,312 |
Most Expensive
60585 leads the pack at $540,818 — a full 24% above the city median. This is Plainfield’s premium market, with home values that put it well into upper-tier suburban pricing for the Chicago metro.
Most Affordable
60544 is the most affordable ZIP at $379,418, sitting 13% below the city average. 60586 comes in close behind at $383,955. Both ZIPs offer entry points under $385K — a meaningful discount compared to the 60585 side of town.
If you’re buying in Plainfield on a budget, 60544 and 60586 are where you start looking. The $161K price gap between the cheapest and most expensive ZIP means your street address has a real impact on what you’ll pay.

Rent vs Buy in Plainfield
Rent data is available for one Plainfield ZIP code. Here’s how the numbers compare.
| Metric | Monthly Cost |
|---|---|
| Rent (ZIP 60586) | $2,755 |
| Estimated Mortgage (median home, 20% down, 7%) | ~$2,315 |
| Estimated Mortgage + Taxes/Insurance | ~$3,000+ |
The rent in 60586 is $2,755 per month. A mortgage on the median-priced Plainfield home — assuming 20% down and a 7% interest rate — costs about $2,315 in principal and interest. But Illinois property taxes change the equation fast.
Will County’s effective property tax rate hovers around 2.5-3%. On a $435K home, that adds $900+ per month to your housing costs. Factor in homeowner’s insurance and you’re easily above $3,000 per month.
Renting at $2,755 is cheaper on a monthly basis. But rent doesn’t build equity. Over 30 years, that mortgage payment buys you an asset. The 2.8% annual appreciation means Plainfield homes are gaining value — your rent payment doesn’t do that.
The rent-vs-buy decision here comes down to how long you plan to stay. If you’re in Plainfield for 5+ years, buying makes more sense despite the higher monthly cost. Short-term? Renting wins on cash flow.
Plainfield Housing Market Trends
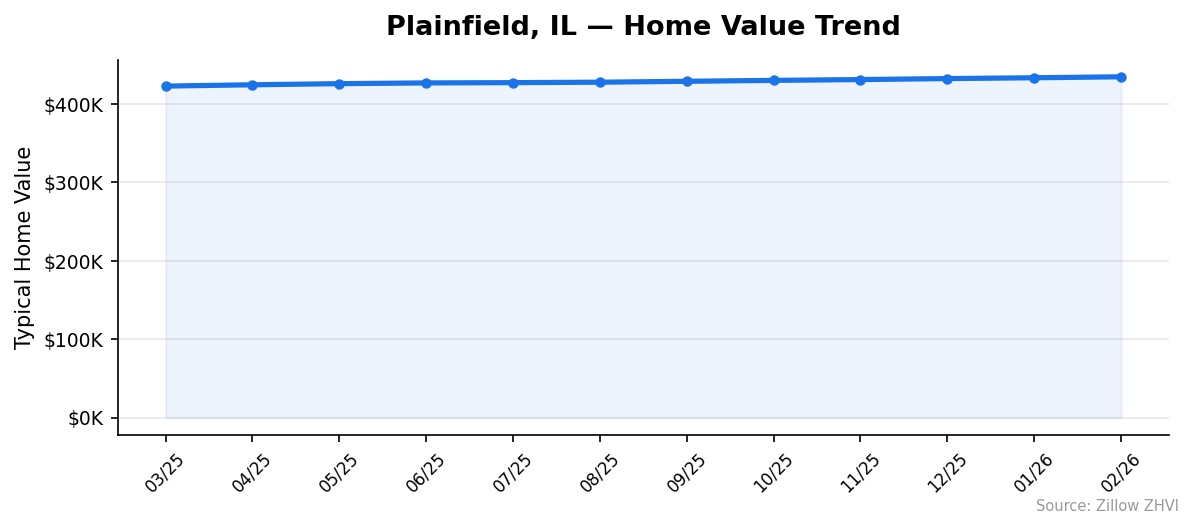
Plainfield has posted gains every month for the past 12 months. Not a single down month.
| Month | Median Home Value | Monthly Change |
|---|---|---|
| Feb 2026 | $434,730 | +$1,255 |
| Jan 2026 | $433,475 | +$1,016 |
| Dec 2025 | $432,459 | +$1,275 |
| Nov 2025 | $431,184 | +$1,036 |
| Oct 2025 | $430,148 | +$1,160 |
| Sep 2025 | $428,988 | +$1,171 |
| Aug 2025 | $427,817 | +$556 |
| Jul 2025 | $427,261 | +$356 |
| Jun 2025 | $426,905 | +$941 |
| May 2025 | $425,964 | +$1,429 |
| Apr 2025 | $424,535 | +$1,651 |
| Mar 2025 | $422,884 | — |
Twelve straight months of gains. The total increase from March 2025 to February 2026 was $11,846 — a 2.8% rise.
The pace picked up in late 2025. Monthly gains from August through October averaged over $1,100, compared to summer months where appreciation slowed to $350-$550 per month. The fall and winter months actually showed stronger momentum than summer — unusual for most housing markets.
Is Plainfield a Good Place to Buy in 2026?
The data points to a seller’s market. Twelve consecutive months of price increases with no signs of a reversal. That’s not a market where buyers have much bargaining power.
But context matters. A 2.8% annual gain is below the national average for the past decade. Plainfield isn’t overheating — it’s grinding higher at a sustainable pace. That’s arguably healthier than the boom-and-bust swings other metros have experienced.
The ZIP-level price spread gives buyers options. If 60585 at $541K is out of reach, 60544 at $379K is a 30% discount. Not every suburb offers that kind of range within its borders.
Plainfield’s position in the Chicago metro is a factor too. It’s far enough from the city center to offer suburban pricing but connected enough to benefit from metro-wide job growth. The steady appreciation suggests demand isn’t going away.
For buyers who can handle the monthly cost — especially those Illinois property taxes — Plainfield’s track record of consistent, moderate appreciation makes it a reasonable bet.
Plainfield Housing Market Outlook for 2026-2027
The 12-month trend shows acceleration. Monthly gains have been growing since mid-2025, averaging over $1,100 per month in the most recent quarter compared to $400-$500 during summer 2025.
If the current pace continues, Plainfield’s median could push past $440K by mid-2026. The three-month trend from December 2025 through February 2026 averaged $1,182 per month in appreciation.
Nothing in the data suggests a price correction is coming. The gains are steady, not speculative. There are no sharp spikes followed by plateaus — just a consistent upward slope.
That said, mortgage rates remain a wildcard the data can’t predict. Any significant rate drop could accelerate gains. A rate spike could slow them. Based purely on the trend data, expect prices to keep climbing at roughly the same 2-3% annual pace through 2027.
Similar Markets in IL
If you’re shopping in the Chicago suburbs, these Illinois markets are worth comparing.
- Naperville — Plainfield’s neighbor and one of the most sought-after suburbs in the metro. Expect higher prices.
- Aurora — The second-largest city in Illinois offers more price diversity than Plainfield.
- Joliet — South of Plainfield with typically lower home values and a shorter commute to I-80.
- Schaumburg — Northwest suburb with a different price profile but similar suburban appeal.
- Chicago — The city itself offers everything from $200K condos to multimillion-dollar homes.
Frequently Asked Questions
What is the average home price in Plainfield?
The average home price in Plainfield, IL is $434,730 as of February 2026. Prices vary widely by ZIP code — from $379,418 in 60544 to $540,818 in 60585. The city-wide median has increased 2.8% over the past year.
Are home prices going up or down in Plainfield?
Prices are going up. Plainfield recorded 12 consecutive months of gains from March 2025 through February 2026, adding $11,846 to the median home value. The year-over-year increase is 2.8%, with the pace of appreciation picking up in recent months.
Is it cheaper to rent or buy in Plainfield?
On a monthly basis, renting is cheaper. Rent in ZIP 60586 averages $2,755 per month. A mortgage on the median-priced home (20% down, 7% rate) plus property taxes and insurance runs over $3,000 monthly. However, buying builds equity in an appreciating market.
What is the most affordable neighborhood in Plainfield?
ZIP code 60544 is the most affordable at $379,418 — about $55,000 below the city median. ZIP 60586 is a close second at $383,955. Both offer entry points well under $400K.
Methodology
Home values are based on the Zillow Home Value Index (ZHVI), a smoothed measure of typical home values in the 35th to 65th percentile range. Rent estimates use the Zillow Observed Rent Index (ZORI). Population figures come from the U.S. Census Bureau Population Estimates Program (2020-2024 vintage). All datasets are publicly available. Housing data updated 2026-02-28.