Lincoln Home Prices: $344K, Up 4.4% — 20 ZIPs Analyzed (2026)
$343,948. That’s the price of a typical home in Lincoln right now. A year ago, it was about $15,000 less. The capital city of Nebraska has posted steady gains for 12 straight months, and there’s no sign of a reversal.
Quick answer: The average home price in Lincoln, NE is $343,948 as of February 2026, up 4.4% year over year according to Zillow.
Current Home Prices in Lincoln
Lincoln’s housing market sits firmly in growth mode. The median home value reached $343,948 in February 2026, with prices spread across a wide range depending on neighborhood.
| Metric | Value |
|---|---|
| Median Home Price | $343,948 |
| Year-Over-Year Change | +4.4% |
| Lowest ZIP Value | $196,608 |
| Highest ZIP Value | $581,122 |
| ZIP Codes Tracked | 20 |
| Data Month | February 2026 |
That 4.4% annual increase means a Lincoln homeowner gained roughly $14,500 in equity over the past year without lifting a finger. The gap between the cheapest and most expensive neighborhoods is striking — the priciest ZIP costs nearly three times the cheapest.
Lincoln remains affordable by national standards. The $344K median puts it well below the U.S. median, which hovered near $360K in early 2026. For a Midwestern state capital with a growing university and a population topping 300,000, these numbers are still within reach for many buyers.
The month-over-month pace has been accelerating. From January to February 2026, the median jumped $1,636. The prior month saw a $2,031 gain. This quickening pace tracks with seasonal buying patterns heading into spring.
Lincoln Home Prices by Neighborhood
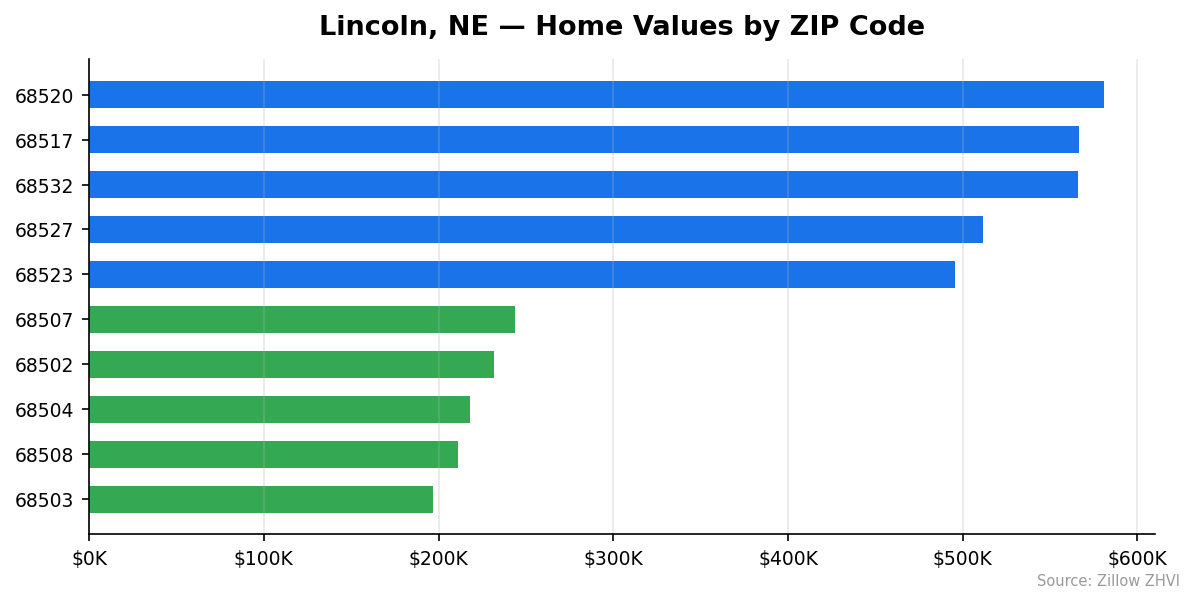
Lincoln’s 20 tracked ZIP codes show a nearly 3:1 spread from cheapest to most expensive. Here’s every neighborhood ranked by home value.
| ZIP Code | Median Home Value | Monthly Rent |
|---|---|---|
| 68520 | $581,122 | $1,391 |
| 68517 | $566,516 | — |
| 68532 | $565,749 | — |
| 68527 | $511,399 | — |
| 68523 | $495,753 | — |
| 68526 | $456,729 | $1,331 |
| 68516 | $380,691 | $1,437 |
| 68512 | $342,846 | $1,536 |
| 68528 | $282,356 | $1,385 |
| 68521 | $283,152 | $1,529 |
| 68506 | $276,243 | $1,237 |
| 68522 | $273,147 | $1,199 |
| 68505 | $257,051 | $1,414 |
| 68524 | $255,730 | — |
| 68510 | $249,112 | $1,187 |
| 68507 | $243,992 | $1,717 |
| 68502 | $231,622 | $889 |
| 68504 | $218,201 | $1,204 |
| 68508 | $210,939 | $880 |
| 68503 | $196,608 | $1,291 |
Most Expensive ZIPs
68520 — $581,122. Lincoln’s priciest neighborhood commands a 69% premium over the city median, yet rents here run just $1,391, well below what you’d expect for the price tier.
68517 — $566,516. At 65% above the median, this ZIP sits in Lincoln’s upper tier. No rent data is available, suggesting a predominantly owner-occupied area.
68532 — $565,749. Nearly tied with 68517, this is another half-million-dollar neighborhood. Like 68517, the lack of rental data points to a homeownership-heavy community.
Most Affordable ZIPs
68503 — $196,608. The only ZIP under $200K. Homes here cost 43% less than the city median, making it the clear entry point for budget buyers. Rents sit at $1,291.
68508 — $210,939. At 39% below the median and with the lowest rent in the city at $880, this is Lincoln’s best deal for both buyers and renters.
68504 — $218,201. Priced 37% below the median with rents at $1,204, this ZIP offers a middle ground between the cheapest options and the city average.
Rent vs Buy in Lincoln
Renting is cheaper on a pure monthly basis in Lincoln. But the gap varies wildly by ZIP code.
Take a median-priced home at $343,948. Put 20% down ($68,790), and you’re financing $275,158. At a 7% mortgage rate over 30 years, the principal and interest payment is roughly $1,830. Add property taxes and insurance, and you’re looking at $2,200–$2,400 per month.
Now look at rents. Across the 15 ZIPs with rental data, typical rents range from $880 to $1,717.
| ZIP | Home Value | Monthly Rent | Est. Mortgage* |
|---|---|---|---|
| 68508 | $210,939 | $880 | $1,350 |
| 68502 | $231,622 | $889 | $1,490 |
| 68503 | $196,608 | $1,291 | $1,260 |
| 68507 | $243,992 | $1,717 | $1,570 |
| 68512 | $342,846 | $1,536 | $2,200 |
| 68520 | $581,122 | $1,391 | $3,730 |
*Estimated monthly P&I at 7% with 20% down. Does not include taxes or insurance.
The standout anomaly is 68507 — rents here hit $1,717, the highest in the city, despite a home value of just $243,992. That’s a terrible deal for renters. Buying would cost roughly the same monthly while building equity.
On the flip side, 68520 has $581K homes but only $1,391 in rent. Renters there save over $2,300 a month compared to buying.
For most Lincoln ZIPs, buying costs 40–60% more per month than renting. The equity-building argument still applies, but the monthly cash flow difference is real.
Population Growth and Migration
Lincoln is one of the few Nebraska cities that’s actually growing.
The city’s population hit 300,619 in 2024, crossing the 300K mark for the first time. That’s a 3.0% increase from 291,837 in 2020 — roughly 8,800 new residents in four years.
| Year | Population |
|---|---|
| 2020 | 291,837 |
| 2021 | 291,691 |
| 2022 | 293,306 |
| 2023 | 296,810 |
| 2024 | 300,619 |
Growth wasn’t instant. The city actually dipped slightly in 2021, losing 146 people. But from 2022 onward, the gains accelerated — 1,615 new residents in 2022, then 3,504 in 2023, and 3,809 in 2024.
Compare that to its Nebraska peers:
| City | 2024 Population | 4-Year Growth |
|---|---|---|
| Lincoln | 300,619 | +3.0% |
| Grand Island | 53,250 | +0.4% |
| Bellevue | 64,777 | -0.6% |
| Omaha | 489,265 | -0.7% |
Omaha, despite being the state’s largest city, lost population over the same period. Bellevue shrank too. Only Grand Island showed any growth at all, and at 0.4%, it barely moved.
Lincoln’s population growth puts upward pressure on housing demand. More people competing for the same housing stock means prices go up — which is exactly what the data shows.
Lincoln Housing Market Trends
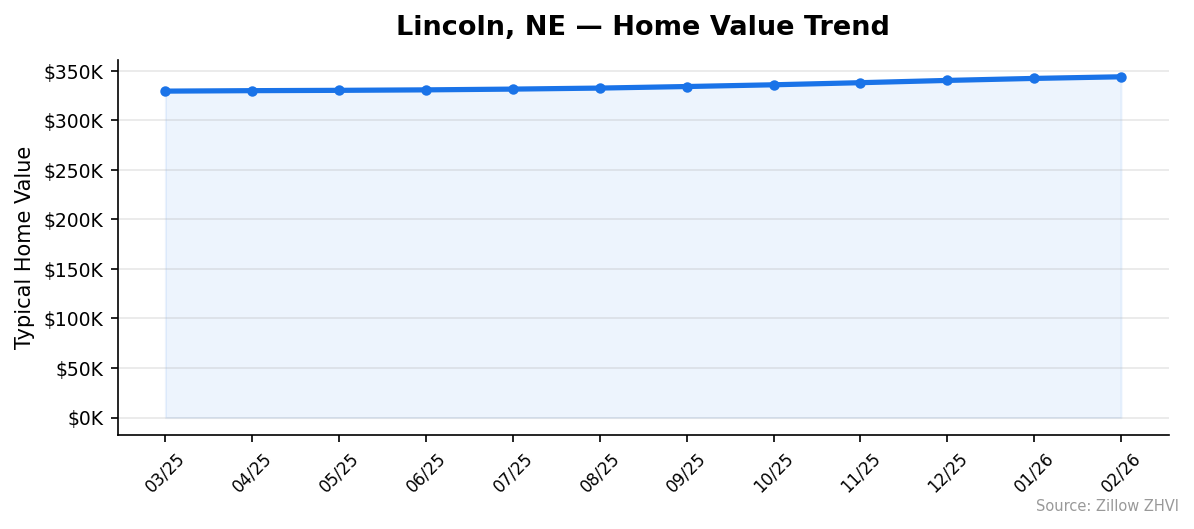
Lincoln posted gains every single month over the past year. Here’s the full 12-month timeline.
| Month | Median Home Value | Monthly Change |
|---|---|---|
| Feb 2026 | $343,948 | +$1,636 |
| Jan 2026 | $342,312 | +$2,031 |
| Dec 2025 | $340,281 | +$2,292 |
| Nov 2025 | $337,989 | +$2,116 |
| Oct 2025 | $335,873 | +$1,756 |
| Sep 2025 | $334,117 | +$1,568 |
| Aug 2025 | $332,549 | +$1,029 |
| Jul 2025 | $331,520 | +$765 |
| Jun 2025 | $330,755 | +$482 |
| May 2025 | $330,273 | +$322 |
| Apr 2025 | $329,951 | +$468 |
| Mar 2025 | $329,483 | — |
The pattern is clear: gains started small in spring 2025 and grew larger through winter. March through June 2025 saw monthly increases under $500. By December, the monthly gain exceeded $2,000.
Total appreciation from March 2025 to February 2026: $14,465, or 4.4%. That’s about $1,205 per month in equity gains for homeowners.
The price floor also rose. The cheapest ZIP went from $186,210 in March 2025 to $196,608 in February 2026 — a $10,398 increase. Even the most affordable corners of Lincoln are getting more expensive.
Is Lincoln a Good Place to Buy in 2026?
The data points to a seller’s market. Prices have risen for 12 consecutive months, the population is growing faster than anywhere else in Nebraska, and the cheapest ZIPs are getting pricier.
If you’re buying: act on the affordable end. ZIPs 68503, 68508, and 68504 all sit under $220K. These prices won’t last if growth continues at the current pace. A 4.4% annual gain on a $200K home adds $8,800 per year — waiting costs you.
If you’re selling: the trend favors patience. Monthly gains have been accelerating since mid-2025. Listing in late spring or summer 2026 could capture peak seasonal demand on top of the existing upward trend.
For investors: ZIP 68507 stands out. Rents are the highest in the city at $1,717, but home prices sit at just $244K. That’s a strong rent-to-price ratio compared to the rest of Lincoln.
Lincoln Housing Market Outlook for 2026-2027
The 12-month trend shows accelerating gains. Monthly price increases roughly quadrupled from spring to winter — $322 in May 2025 versus $2,031 in January 2026.
If the current pace continues through spring and summer 2026, the median could push toward $355K–$360K by the end of the year. The 3-month trend from December 2025 through February 2026 averaged about $1,986 per month in gains.
Population growth supports this trajectory. Lincoln added nearly 3,800 residents in 2024 alone, and that demand has to go somewhere.
The risk? Rising mortgage rates could cool affordability, especially at the high end. But Lincoln’s sub-$350K median gives it more room to absorb rate increases than pricier metros. A home at $344K with 20% down at 7% is still manageable for a dual-income household.
Barring a sharp economic downturn, the data suggests continued — though potentially moderating — price growth into 2027.
Similar Markets in NE
If you’re shopping in Nebraska, these nearby markets are worth comparing:
- Omaha — The state’s largest city has a shrinking population, which could mean less competition and better deals for buyers.
- Bellevue — Just south of Omaha, Bellevue also lost residents over the past four years. Worth watching if Lincoln feels too pricey.
- Stanton — A small-town alternative for buyers priced out of the Lincoln metro.
Frequently Asked Questions
What is the average home price in Lincoln?
The average home price in Lincoln is $343,948 as of February 2026. Prices range from $196,608 in the most affordable ZIP code (68503) to $581,122 in the most expensive (68520). The city-wide median sits just below the national average.
Are home prices going up or down in Lincoln?
Prices are going up. Lincoln’s median home value increased 4.4% year over year, with gains recorded in all 12 months tracked. The monthly pace of increases has been accelerating since mid-2025.
Is it cheaper to rent or buy in Lincoln?
Renting is cheaper on a monthly basis in most Lincoln neighborhoods. Typical rents range from $880 to $1,717, while mortgage payments on the median home run $2,200–$2,400 including taxes and insurance. The exception is ZIP 68507, where rents are high enough that buying costs roughly the same per month.
What is the most affordable neighborhood in Lincoln?
ZIP code 68503 is the most affordable at $196,608 — the only Lincoln ZIP under $200K. That’s 43% below the city median. Nearby ZIPs 68508 ($210,939) and 68504 ($218,201) are also well below average.
Methodology
Home values are based on the Zillow Home Value Index (ZHVI), a smoothed measure of typical home values in the 35th to 65th percentile range. Rent estimates use the Zillow Observed Rent Index (ZORI). Population figures come from the U.S. Census Bureau Population Estimates Program (2020-2024 vintage). All datasets are publicly available. Housing data updated 2026-02-28.