Carlsbad Home Prices: $1,373K, Up 5% — 4 ZIPs Analyzed (2026)
$1,373,372. That’s what a typical home costs in Carlsbad right now — and the number keeps climbing. Prices rose 5.0% over the past year, pushing this North County San Diego city further into seven-figure territory. Even the cheapest ZIP code here starts above $1.27 million.
Quick answer: The average home price in Carlsbad, CA is $1,373,372 as of February 2026, up 5.0% year over year according to Zillow.
Current Home Prices in Carlsbad
Here’s where the market stands as of February 2026:
| Metric | Value |
|---|---|
| Median Home Price | $1,373,372 |
| Year-over-Year Change | +5.0% |
| Lowest ZIP Median | $1,273,996 |
| Highest ZIP Median | $1,554,180 |
| ZIP Codes Tracked | 4 |
A 5% annual gain adds roughly $65,000 to the typical home’s value in a single year. That’s more than the median U.S. household income.
The spread between the cheapest and most expensive neighborhoods is about $280,000. That gap has widened slightly over the past 12 months, with the pricier areas appreciating faster in absolute terms.
Carlsbad sits within the San Diego-Chula Vista-Carlsbad metro area. Even by San Diego County standards, these are premium prices. You’re paying for proximity to the coast, strong schools, and a relatively small-city feel inside a major metro.
Carlsbad Home Prices by Neighborhood
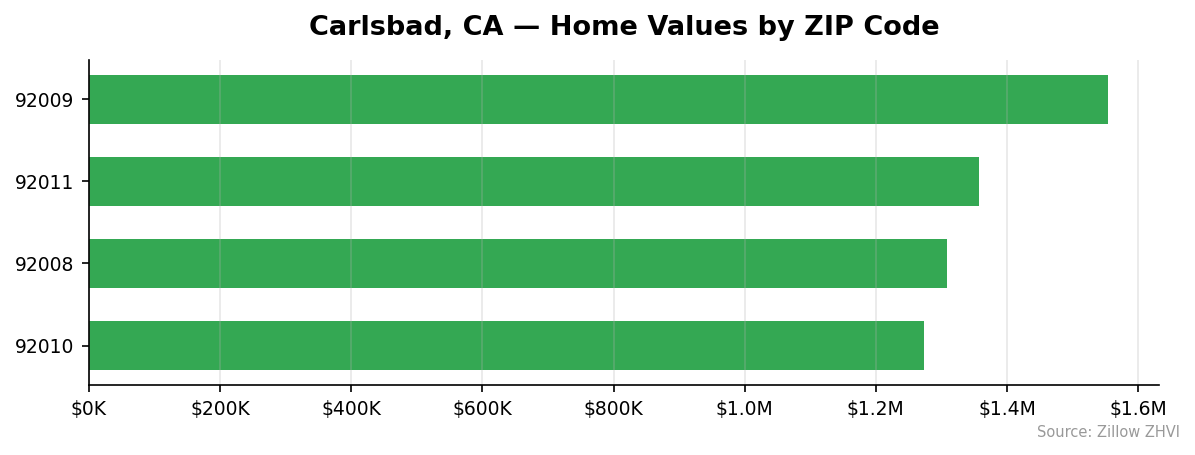
All four Carlsbad ZIP codes sit above $1.27 million. Here’s how they compare:
| ZIP Code | Median Home Value | Monthly Rent |
|---|---|---|
| 92009 | $1,554,180 | $3,931 |
| 92011 | $1,356,865 | $4,151 |
| 92008 | $1,308,444 | $3,084 |
| 92010 | $1,273,996 | $3,508 |
Most Expensive
92009 leads Carlsbad at $1,554,180 — roughly $181,000 above the city median. Despite having the highest home values, its rent of $3,931/month actually falls below the city’s top rental price. That disconnect between purchase price and rent suggests strong owner-occupier demand.
Most Affordable
92010 is the entry point at $1,273,996, about $99,000 below the city average. Rents here run $3,508/month, making it a middle-of-the-pack option for renters. 92008 follows closely at $1,308,444 and offers the lowest rents in the city at $3,084/month — your best bet if you’re renting in Carlsbad on a relative budget.
One thing stands out: 92011 has the second-lowest home prices but the highest rents at $4,151/month. That unusual ratio could signal strong rental demand or a tighter supply of rental units in that area.
Rent vs Buy in Carlsbad
Buying in Carlsbad requires serious financial commitment. Here’s a rough monthly comparison:
| ZIP | Monthly Rent | Est. Mortgage Payment* |
|---|---|---|
| 92009 | $3,931 | ~$8,200 |
| 92011 | $4,151 | ~$7,100 |
| 92008 | $3,084 | ~$6,900 |
| 92010 | $3,508 | ~$6,700 |
*Estimated at 6.5% rate, 20% down, 30-year fixed. Does not include property taxes, insurance, or HOA.
The average rent across Carlsbad’s four ZIPs is about $3,669/month. The average mortgage payment on a median-priced home runs roughly double that.
Renting saves you $3,000 to $4,300 per month in cash flow depending on the neighborhood. That gap is wide enough to make renting the rational short-term choice for most buyers — unless you expect prices to keep climbing at 5% annually.
At current prices, you’d need a household income north of $300,000 to comfortably afford a mortgage on the median Carlsbad home. That’s assuming the standard 28% debt-to-income guideline.
Population Growth and Migration
Carlsbad is getting smaller, not larger. The city lost 1,355 residents between 2020 and 2024 — a 1.2% decline.
| Year | Population |
|---|---|
| 2020 | 114,930 |
| 2021 | 114,968 |
| 2022 | 114,586 |
| 2023 | 113,920 |
| 2024 | 113,575 |
The decline has been steady. Each year brought fewer residents than the last, with the biggest single-year drop between 2022 and 2023 (666 people).
Compare that to other California cities:
| City | 2024 Population | 4-Year Growth |
|---|---|---|
| Bakersfield | 417,468 | +3.0% |
| Sacramento | 535,798 | +1.9% |
| San Diego | 1,404,452 | +1.4% |
| Fresno | 550,105 | +1.4% |
| Oakland | 443,554 | +0.6% |
| Carlsbad | 113,575 | -1.2% |
Every comparison city is growing. Carlsbad is the outlier.
A shrinking population paired with rising prices suggests this isn’t an affordability-driven exodus reducing demand. More likely, the housing stock simply isn’t turning over. Existing homeowners stay put, few new units get built, and potential residents look elsewhere because they can’t find or afford inventory.
Carlsbad Housing Market Trends
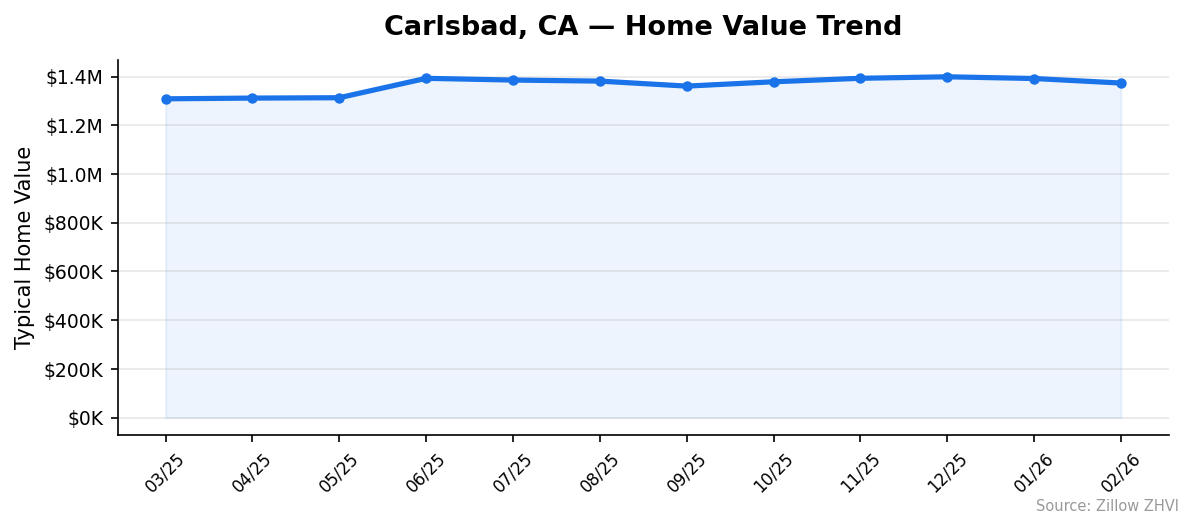
The past 12 months show a market that dipped mid-year and then recovered:
| Month | Avg. Median | Low | High |
|---|---|---|---|
| Feb 2026 | $1,373,372 | $1,273,996 | $1,554,180 |
| Jan 2026 | $1,391,896 | $1,271,122 | $1,552,939 |
| Dec 2025 | $1,398,983 | $1,267,204 | $1,552,843 |
| Nov 2025 | $1,392,843 | $1,260,855 | $1,550,333 |
| Oct 2025 | $1,378,449 | $1,256,594 | $1,547,250 |
| Sep 2025 | $1,360,759 | $1,253,485 | $1,543,977 |
| Aug 2025 | $1,381,278 | $1,253,914 | $1,543,925 |
| Jul 2025 | $1,385,540 | $1,256,304 | $1,548,498 |
| Jun 2025 | $1,392,667 | $1,260,389 | $1,557,473 |
| May 2025 | $1,313,042 | $1,045,366 | $1,567,495 |
| Apr 2025 | $1,311,547 | $1,019,736 | $1,573,955 |
| Mar 2025 | $1,308,572 | $1,004,615 | $1,573,140 |
The low point came in March 2025 at $1,308,572. From there, prices climbed sharply through June, pulled back slightly over the summer, and then pushed to a peak of $1,398,983 in December 2025. February 2026 shows a $25,611 dip from that December high.
Notice the floor rising: the cheapest ZIP went from $1,004,615 in March 2025 to $1,273,996 in February 2026 — a 26.8% increase at the bottom of the market. Meanwhile, the ceiling (most expensive ZIP) actually dropped from $1,573,140 to $1,554,180. The price gap compressed.
Is Carlsbad a Good Place to Buy in 2026?
The numbers paint a clear picture: Carlsbad favors sellers.
Prices are up 5% year over year. The population is shrinking, which limits new supply. And the rent-to-buy gap is enormous — you’d pay roughly twice as much per month to own versus rent.
For buyers, the math is tough. You need a large down payment ($275,000 at 20% on the median home) and a household income well into six figures. Monthly payments including taxes and insurance could easily exceed $9,000.
But for those who can afford it, Carlsbad has shown price resilience. Even during the mid-2025 soft patch, the market recovered within a few months. The floor price across all ZIPs rose significantly over the trailing year.
If you’re deciding between renting and buying here, the financial case for renting is strong in the short term. The case for buying rests on long-term appreciation and the assumption that Carlsbad’s limited housing stock will keep prices elevated.
Carlsbad Housing Market Outlook for 2026-2027
The three-month trend from December 2025 through February 2026 shows a modest pullback — prices dropped from $1,398,983 to $1,373,372, a decline of about 1.8%.
If the current pace continues, Carlsbad could see prices stabilize in the $1,350,000-$1,400,000 range through mid-2026. The market followed a similar pattern last year: a spring dip followed by a summer recovery.
The floor price has been climbing steadily, rising from $1,253,485 in September 2025 to $1,273,996 in February 2026. That upward pressure on the lower end suggests the entry-level market is tightening.
Nothing in the data points to a sharp correction. The 5% annual growth rate isn’t driven by a single overheated ZIP — all four neighborhoods have seen gains. Barring a major change in mortgage rates or local employment, expect Carlsbad to hold above $1.3 million through 2027.
Similar Markets in CA
If Carlsbad’s $1.37 million median is out of reach, several other California cities offer different price points:
- San Diego — The larger metro next door, with more inventory and a wider range of price points across its many neighborhoods.
- Chula Vista — South Bay option within the same metro, typically priced well below Carlsbad while still offering San Diego access.
- Anaheim — Orange County alternative with its own coastal proximity and a more diverse housing stock.
- Long Beach — LA County’s waterfront city, offering urban amenities at prices below Carlsbad’s floor.
- Bakersfield — Central Valley market with California’s strongest recent population growth at 3.0%, at a fraction of coastal prices.
Frequently Asked Questions
What is the average home price in Carlsbad?
The average home price in Carlsbad is $1,373,372 as of February 2026. Prices span from $1,273,996 in ZIP code 92010 to $1,554,180 in 92009. All four Carlsbad ZIP codes are priced above $1.27 million.
Are home prices going up or down in Carlsbad?
Prices are up 5.0% year over year. The market hit a 12-month peak of $1,398,983 in December 2025 and has pulled back slightly to $1,373,372 in February 2026. The overall direction remains upward, with the floor price across all ZIPs rising 26.8% since March 2025.
Is it cheaper to rent or buy in Carlsbad?
Renting is significantly cheaper. Average rent across Carlsbad runs about $3,669/month, while a mortgage on the median home (20% down, 6.5% rate) costs roughly $7,200/month before taxes and insurance. You’d save $3,000 to $4,300 per month by renting, depending on the ZIP code.
What is the most affordable neighborhood in Carlsbad?
ZIP code 92010 has the lowest median home value at $1,273,996. For the lowest rents, look at 92008, where the typical monthly rent is $3,084 — about $1,067 less than the most expensive rental ZIP (92011 at $4,151/month).
Methodology
Home values are based on the Zillow Home Value Index (ZHVI), a smoothed measure of typical home values in the 35th to 65th percentile range. Rent estimates use the Zillow Observed Rent Index (ZORI). Population figures come from the U.S. Census Bureau Population Estimates Program (2020-2024 vintage). All datasets are publicly available. Housing data updated 2026-02-28.