Bloomington Home Prices: $279K, Up 3.1% — 4 ZIPs Analyzed (2026)
$278,657. That is what a typical home is worth in Bloomington, IL as of February 2026. Prices are up 3.1% from a year ago, and four ZIP codes split the city into very different price tiers.
Quick answer: The average home price in Bloomington, IL is $278,657 as of February 2026, up 3.1% year over year according to Zillow.
Current Home Prices in Bloomington
The median sits at $278,657. A year ago, the same measure was around $270,332. That works out to a 3.1% gain — modest by recent standards, but firmly positive.
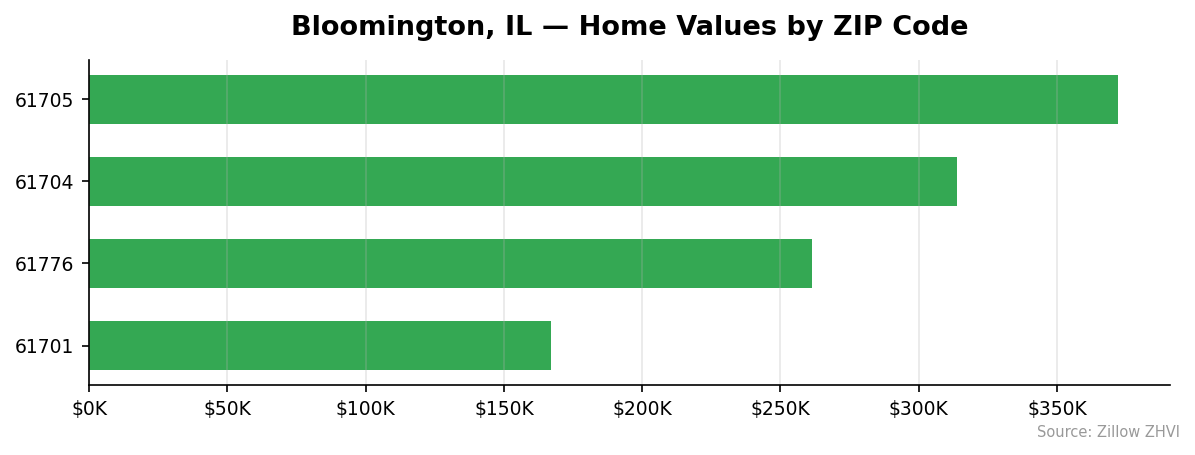
The price spread inside the city is wide. The cheapest ZIP comes in at $167,197. The most expensive is $372,205. That is more than a 2x gap inside a city of about 79,000 people.
| Metric | Value |
|---|---|
| Median home value | $278,657 |
| Year-over-year change | +3.1% |
| Cheapest ZIP | $167,197 (61701) |
| Most expensive ZIP | $372,205 (61705) |
| Price range | $167K – $372K |
| ZIPs analyzed | 4 |
| Data through | February 2026 |
The gain here is slower than the broader U.S. number for many recent years, but it is faster than several other markets in central Illinois. You are not seeing a price decline. You are also not seeing a boom. Bloomington is grinding higher month after month, with a single $93 monthly dip between January and February 2026 — small enough to be noise.
For a buyer, the practical takeaway is that waiting has cost money over the past year. For a seller, listing prices a year ago would have left roughly $8,000 on the table compared to today.
Bloomington Home Prices by Neighborhood
Four ZIPs cover the city. The price difference between them is the single biggest factor in what a Bloomington home costs.
| ZIP | Median Value | Typical Rent | vs. City Median |
|---|---|---|---|
| 61705 | $372,205 | — | +34% |
| 61704 | $313,670 | $1,550 | +13% |
| 61776 | $261,554 | — | -6% |
| 61701 | $167,197 | $1,117 | -40% |
Most Expensive
- 61705 — $372,205. The priciest ZIP in the city, sitting 34% above the Bloomington median.
- 61704 — $313,670. The second-priciest area, with rent data showing a typical asking rent of $1,550.
- 61776 — $261,554. Slightly below the city median but still the third-highest of the four ZIPs.
Most Affordable
- 61701 — $167,197. The clear bargain ZIP, with rents around $1,117 and home values 40% below the city median.
- 61776 — $261,554. A middle-of-the-road option for buyers who want to spend less than the city median without dropping into the cheapest tier.
- 61704 — $313,670. Not cheap by Bloomington standards, but every other expensive option in the city is in 61705.
Rent vs Buy in Bloomington
Rent data is available for two of the four ZIPs. In 61704, the typical rent is $1,550. In 61701, it is $1,117. The home values in those ZIPs are $313,670 and $167,197.
That gives a price-to-rent ratio of about 17 in 61704 ($313,670 ÷ ($1,550 × 12)) and about 12 in 61701 ($167,197 ÷ ($1,117 × 12)).
A ratio above 15 generally favors renting. A ratio under 15 generally favors buying, all else equal. By that rule, 61701 leans toward buying, and 61704 leans the other way.
There is a different story behind those numbers. In 61704 you are paying for a more expensive house, and rent has not kept up with that price tag. In 61701, rents are closer to what owning would cost, so the math for first-time buyers is less hostile.
Rent figures for ZIPs 61705 and 61776 are not in the dataset. If you are looking at those areas, the price-to-rent comparison cannot be calculated from this data.
Population Growth and Migration
Bloomington had 79,232 residents in 2024, up from 78,692 in 2020. That is a 0.7% gain over four years — slow growth, but growth.
| Year | Population |
|---|---|
| 2020 | 78,692 |
| 2021 | 78,828 |
| 2022 | 78,939 |
| 2023 | 78,952 |
| 2024 | 79,232 |
The 2023-to-2024 jump is the largest single-year gain in the window. Before that, growth was nearly flat for two years.
Compared to other Illinois cities, Bloomington sits in the middle of the pack:
| City | 2024 Population | 4-Year Growth |
|---|---|---|
| Champaign | 91,961 | +4.0% |
| Naperville | 153,124 | +2.5% |
| Joliet | 151,837 | +1.0% |
| Bloomington | 79,232 | +0.7% |
| Aurora | 180,710 | +0.2% |
| Elgin | 114,701 | 0.0% |
Champaign is growing roughly six times faster. Naperville is growing about three times faster. But Aurora and Elgin — both larger cities — have nearly stalled.
For housing demand, slow population growth tends to keep price gains in check. The fact that Bloomington prices rose 3.1% while population rose less than 1% suggests something other than headcount is moving the market — likely tight inventory, rate-driven supply pressure, or in-migration that does not show up in city headcount.
Bloomington Housing Market Trends
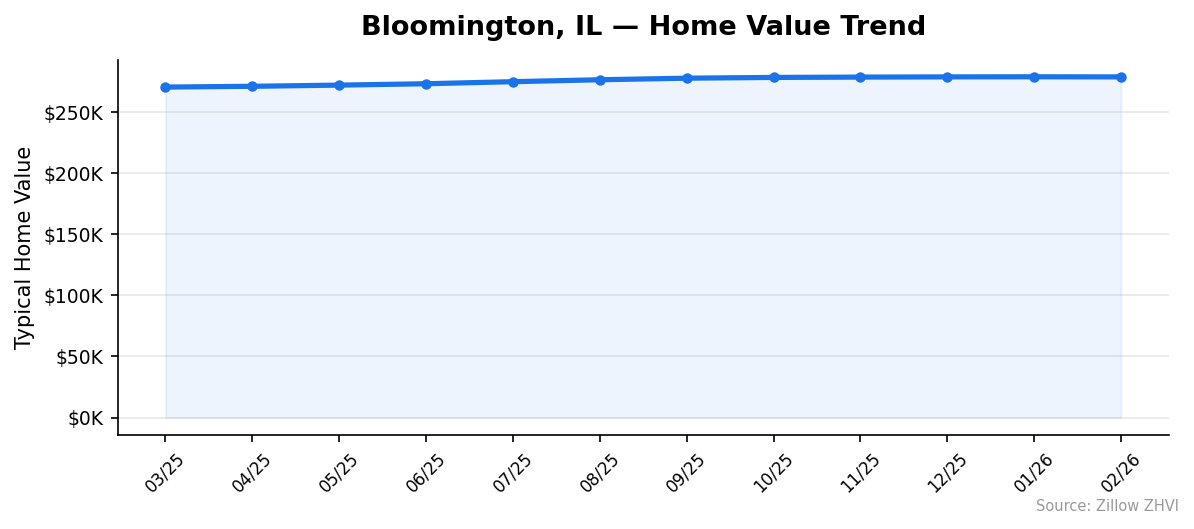
Prices have gone up almost every month for the past year. Here is the 12-month trail:
| Month | Median Value |
|---|---|
| Feb 2026 | $278,657 |
| Jan 2026 | $278,750 |
| Dec 2025 | $278,672 |
| Nov 2025 | $278,497 |
| Oct 2025 | $278,230 |
| Sep 2025 | $277,608 |
| Aug 2025 | $276,321 |
| Jul 2025 | $274,744 |
| Jun 2025 | $273,057 |
| May 2025 | $271,930 |
| Apr 2025 | $270,976 |
| Mar 2025 | $270,332 |
Eleven months of gains, one month down by less than $100. The total move from March 2025 to February 2026 is about $8,300, or 3.1%.
The pace has cooled in the most recent three months. From November 2025 to February 2026, prices added just $160. From August to November, they added $2,176. The summer-to-fall stretch did most of the work.
That cooling matters. If the next three months look like the last three, the annual gain a year from now would be in the low single digits — slower than what just printed.
Is Bloomington a Good Place to Buy in 2026?
The data points to a slow-moving seller’s market, but only barely.
Prices are rising. Inventory has been tight enough to push the median up 3.1% in a city growing at less than 1% per year. That tilts the advantage toward sellers.
But the recent slowdown is real. Three of the last four months added less than $200 each. February actually fell $93. If that pattern holds, the next year of gains will look smaller than the last.
For a buyer with no urgency, waiting is no longer expensive in the way it was through summer 2025. For a buyer who needs to be in by year-end, prices are unlikely to drop in any meaningful way based on the past 12 months. ZIP 61701 remains the best entry point at $167,197, with rents that come close to matching ownership costs.
Bloomington Housing Market Outlook for 2026-2027
The 3-month trend suggests Bloomington prices are flattening. From November 2025 to February 2026, the median moved less than $200 — a near-zero rate of change.
If the current pace continues, the next six months would bring small gains rather than the steady climb seen through summer 2025. A return to the faster pace from June through October would push the median past $280,000 by mid-summer. A continued flat stretch would keep it parked near $278,000–$279,000.
Population growth of 0.7% over four years does not provide strong upward pressure on demand. The recent price moves are doing more work than the underlying headcount would suggest. That makes the market more sensitive to interest rates and listing supply than to migration trends.
Similar Markets in IL
- Champaign — a similarly sized central Illinois city, growing faster than Bloomington at 4.0% over four years.
- Decatur — another mid-size downstate market, useful for comparison if you want a cheaper option in the same region.
- Naperville — a much larger Chicago-area suburb for buyers willing to pay big-city prices.
- Aurora — a large suburb where population growth has nearly stalled despite the city’s size.
- Chicago — the state benchmark, useful as a price ceiling reference for downstate buyers.
Frequently Asked Questions
What is the average home price in Bloomington?
The typical home in Bloomington, IL is worth $278,657 as of February 2026. That number is the median across the four ZIP codes that make up the city, with the cheapest area at $167,197 and the most expensive at $372,205.
Are home prices going up or down in Bloomington?
Prices are up 3.1% year over year, climbing from roughly $270,332 in March 2025 to $278,657 in February 2026. Eleven of the last 12 months posted gains, though the pace has slowed sharply in the last three months.
Is it cheaper to rent or buy in Bloomington?
Month-to-month, renting is cheaper in both ZIPs with rent data. In 61704, the price-to-rent ratio is about 17, which favors renting. In 61701, the ratio is about 12, which is closer to break-even and favors buying for longer-term residents.
What is the most affordable neighborhood in Bloomington?
ZIP 61701 is the most affordable at $167,197 — roughly 40% below the city-wide median. Rents there average $1,117, which is the lowest figure in the dataset.
Methodology
Home values are based on the Zillow Home Value Index (ZHVI), a smoothed measure of typical home values in the 35th to 65th percentile range. Rent estimates use the Zillow Observed Rent Index (ZORI). Population figures come from the U.S. Census Bureau Population Estimates Program (2020-2024 vintage). All datasets are publicly available. Housing data updated 2026-02-28.