Independence Home Prices: $204K, Up 1.5% — 7 ZIPs Analyzed (2026)
$204,311. That’s the median home price in Independence, MO right now — up 1.5% from a year ago. Prices have moved up every month since June 2025, but the city itself is losing residents.
Quick answer: The average home price in Independence, MO is $204,311 as of February 2026, up 1.5% year over year according to Zillow.
Current Home Prices in Independence
Independence sits well below the national median. The Kansas City metro is one of the more affordable major markets in the Midwest, and Independence is on the cheaper end of that metro.
| Metric | Value |
|---|---|
| Median home price | $204,311 |
| Year-over-year change | +1.5% |
| Cheapest ZIP | $117,998 (64053) |
| Most expensive ZIP | $286,783 (64057) |
| Price spread (max ÷ min) | 2.4x |
| ZIP codes analyzed | 7 |
| Metro area | Kansas City, MO-KS |
| Data through | February 2026 |
The 1.5% annual gain is modest. It outpaces the recent trend in many Sun Belt cities where prices fell during 2025, but it lags inflation. In real terms, Independence homeowners are roughly flat.
The price spread tells you something useful. The most expensive ZIP costs 2.4 times the cheapest. That’s a wide gap for a city of 121,000 people. Buyers willing to look across neighborhoods can find dramatically different price points within the same school district boundaries.
The current $204K median puts Independence below the broader Kansas City metro average. It also undercuts most suburbs to the south and east — Lee’s Summit and Blue Springs both run higher.
For buyers priced out of Kansas City proper or the southern suburbs, Independence is one of the few remaining options under $250K with full city services.
Independence Home Prices by Neighborhood
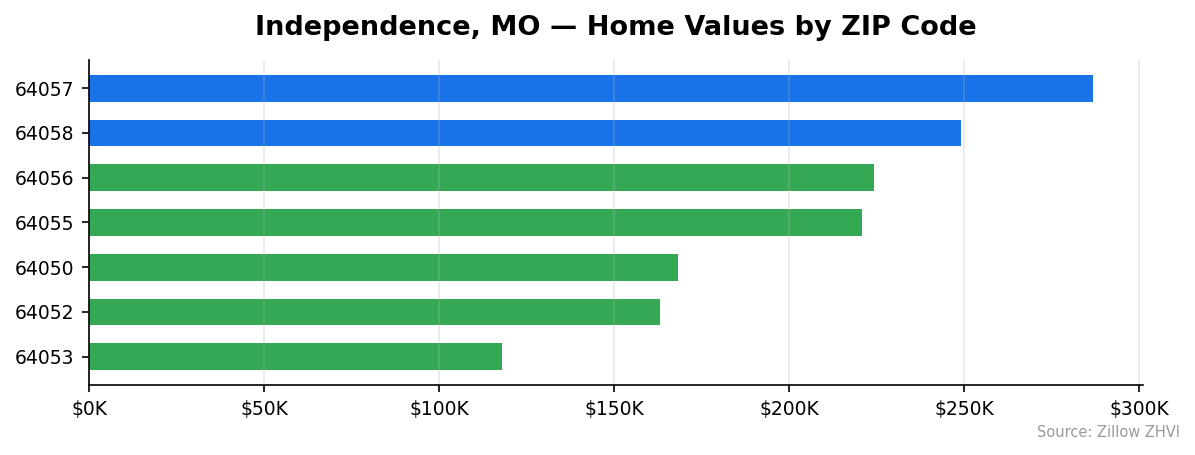
Seven ZIP codes make up the Independence market. The price range is wide — from under $120K to nearly $290K.
| ZIP Code | Median Price | Avg Rent |
|---|---|---|
| 64057 | $286,783 | $1,380 |
| 64058 | $249,007 | — |
| 64056 | $224,150 | $1,728 |
| 64055 | $220,759 | $1,395 |
| 64050 | $168,290 | $1,189 |
| 64052 | $163,193 | $1,178 |
| 64053 | $117,998 | $1,079 |
Most Expensive
64057 leads at $286,783, about 40% above the city average. Despite the high purchase price, rents here ($1,380) sit near the city average — suggesting buyer demand is what drives the premium, not rental yields.
64058 comes in second at $249,007. No rent data is available for this ZIP, but the home values are 22% above the city median.
64056 ranks third at $224,150, with the highest rents in the city at $1,728 per month. The rent-to-price ratio here is the strongest in Independence.
Most Affordable
64053 is the cheapest at $117,998 — 42% below the city average. Rents at $1,079 give this ZIP a rent yield over 10% annually, which is unusual for any US market.
64052 sits at $163,193, about 20% below the city median, with rents of $1,178.
64050 rounds out the bottom three at $168,290, paired with rents of $1,189. This ZIP covers the historic downtown core.
Rent vs Buy in Independence
The math in Independence depends heavily on which ZIP you’re looking at. Citywide, average rent is roughly $1,325 across the six ZIPs with data.
A $204K home with 10% down at current mortgage rates produces a payment around $1,500-$1,700 once you add taxes and insurance. Renting wins on monthly cash flow in most ZIPs.
| Scenario | Cost |
|---|---|
| Citywide average rent | ~$1,325/mo |
| Cheapest ZIP rent (64053) | $1,079/mo |
| Highest ZIP rent (64056) | $1,728/mo |
| Median home price | $204,311 |
But the gap is narrow. In the cheaper ZIPs — 64053 especially — buying at $118K could undercut renting once you factor in equity. A 20% down payment on a $118K home leaves a loan small enough that the mortgage runs below the $1,079 rent.
ZIP 64056 tells the opposite story. Rents at $1,728 are the highest in the city, but home prices at $224K are mid-pack. That’s the rare combination where buying clearly beats renting on monthly cost alone.
For buyers with limited down payments, the appreciation has been slow — 1.5% annually doesn’t generate fast equity. Renters lose less when prices stay flat.
Population Growth and Migration
Independence is losing people. The city had 122,845 residents in 2020 and 121,629 in 2024 — a drop of 1.0% over four years.
| Year | Population |
|---|---|
| 2020 | 122,845 |
| 2021 | 122,149 |
| 2022 | 120,981 |
| 2023 | 121,060 |
| 2024 | 121,629 |
The bottom hit in 2022 at 120,981. Since then, the city has clawed back some residents, gaining about 650 people in two years. The trajectory is no longer falling, but it hasn’t returned to 2020 levels.
Compare that to Missouri’s growth markets:
| City | 2024 Population | 4-Year Growth |
|---|---|---|
| St. Peters | 61,398 | +6.4% |
| Lee’s Summit | 106,419 | +4.8% |
| O’Fallon | 95,355 | +4.0% |
| Blue Springs | 61,246 | +4.0% |
| Columbia | 130,900 | +3.6% |
| Independence | 121,629 | -1.0% |
Lee’s Summit and Blue Springs are both Kansas City suburbs, sitting just south of Independence. Both are growing fast while Independence shrinks. That tells you where the metro’s residential demand is flowing.
For housing demand, a shrinking population caps how fast prices can rise. The 1.5% annual gain in Independence is happening despite — not because of — population trends. Tight supply and metro-wide pressure are doing the work.
Independence Housing Market Trends
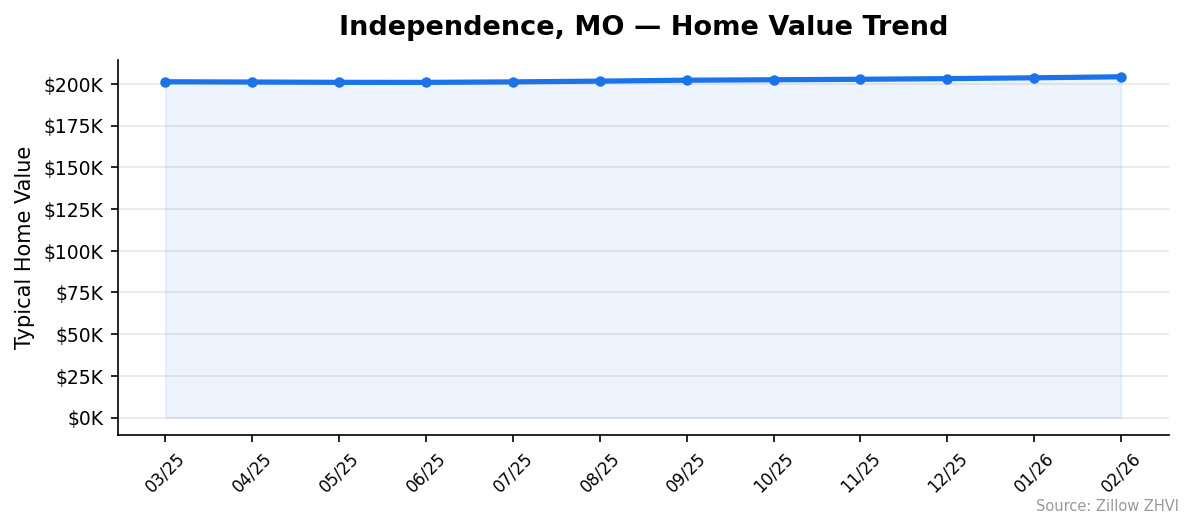
Prices have moved up nine months in a row. The recent monthly gains are small but consistent.
| Month | Median Price | Range |
|---|---|---|
| Feb 2026 | $204,311 | $117,998 – $286,783 |
| Jan 2026 | $203,711 | $118,113 – $286,218 |
| Dec 2025 | $203,208 | $118,649 – $285,597 |
| Nov 2025 | $202,821 | $119,545 – $284,883 |
| Oct 2025 | $202,523 | $120,083 – $284,123 |
| Sep 2025 | $202,270 | $120,752 – $283,420 |
| Aug 2025 | $201,711 | $120,846 – $282,790 |
| Jul 2025 | $201,259 | $120,742 – $282,609 |
| Jun 2025 | $200,953 | $120,382 – $282,799 |
| May 2025 | $200,985 | $120,145 – $282,834 |
| Apr 2025 | $201,167 | $120,245 – $282,870 |
| Mar 2025 | $201,331 | $120,644 – $282,677 |
The pattern: prices dipped slightly from March through June 2025, bottomed at $200,953, then began climbing. Over the past nine months, the median has added $3,358 — roughly $373 per month.
The cheap end is doing the opposite. The minimum ZIP value peaked at $120,846 in August 2025 and has fallen every month since to $117,998. The bottom of the market is softening even as the middle rises.
Top-end prices climbed from $282,677 to $286,783 over the year. That’s a 1.5% gain — exactly matching the citywide average.
Is Independence a Good Place to Buy in 2026?
The case for buying: prices are low for the metro, the trend is positive, and Independence offers more home for the money than Lee’s Summit or southern Kansas City.
The case against: the population is shrinking, appreciation is slow, and rents in most ZIPs beat ownership costs on monthly cash flow.
This is a soft seller’s market. Sellers can expect modest gains. Buyers aren’t getting the discounts seen in some 2024-2025 corrections, but they aren’t fighting bidding wars either. The 1.5% annual price gain barely keeps pace with carrying costs.
For owner-occupiers planning to stay 5+ years, Independence works. For investors, ZIP 64053 stands out — a $118K entry price with $1,079 rents produces yields you won’t find in growth markets.
For flippers, the slow appreciation is a problem. Holding costs eat into thin margins.
Independence Housing Market Outlook for 2026-2027
The 3-month trend points up. Prices added roughly $1,100 from December to February, an annualized pace near 2.2%.
If the current pace continues, the median could approach $208,000-$210,000 by late summer 2026. That’s not a forecast — it’s an extrapolation of recent momentum.
The widening gap between the cheap end (falling) and the top end (rising) is the storyline to watch. A market where the most expensive ZIPs are pulling away while the cheapest ZIP keeps falling suggests buyer demand is concentrating in specific neighborhoods rather than lifting the whole city.
Population trends remain the headwind. Without renewed in-migration, sustained price growth above 2-3% is hard to support.
Similar Markets in MO
- Kansas City — the metro center Independence belongs to.
- Lees Summit — the growing suburb to the south, with higher prices than Independence.
- Saint Joseph — a smaller market that often runs cheaper than Independence.
- Springfield — comparable Midwestern affordability with stronger population growth.
- Columbia — a college town with prices moving in the opposite direction from Independence.
Frequently Asked Questions
What is the average home price in Independence?
The average home price in Independence, MO is $204,311 as of February 2026. That figure is based on the Zillow Home Value Index across 7 ZIP codes within the city.
Are home prices going up or down in Independence?
Prices are up 1.5% year over year. The median has risen every month for the past nine months, gaining roughly $3,400 since the May 2025 low.
Is it cheaper to rent or buy in Independence?
Renting is cheaper month-to-month in most ZIPs. Citywide average rent is around $1,325, while a typical mortgage on the $204K median runs $1,500-$1,700 with taxes and insurance. ZIP 64056 is the exception — high rents there favor buying.
What is the most affordable neighborhood in Independence?
ZIP 64053 is the cheapest at $117,998 — about 42% below the city average. Rents there average $1,079, producing one of the highest rent-to-price ratios in the entire Kansas City metro.
Methodology
Home values are based on the Zillow Home Value Index (ZHVI), a smoothed measure of typical home values in the 35th to 65th percentile range. Rent estimates use the Zillow Observed Rent Index (ZORI). Population figures come from the U.S. Census Bureau Population Estimates Program (2020-2024 vintage). All datasets are publicly available. Housing data updated 2026-02-28.