Bryan Home Prices: $282K, Up 0.9% — 5 ZIPs Analyzed (2026)
$281,853. That’s the typical home value in Bryan, TX as of February 2026, up 0.9% from a year ago. Prices have moved higher in nearly every month over the past year, but the pace is slow — closer to inflation than the double-digit run-ups Texas saw earlier this decade.
Quick answer: The average home price in Bryan, TX is $281,853 as of February 2026, up 0.9% year over year according to Zillow.
Current Home Prices in Bryan
The Bryan housing market sits well below the Texas average and far below neighboring Austin and Houston metros. Five ZIP codes make up the city’s residential map, and the spread between them is wide — more than $220,000 separates the cheapest ZIP from the priciest.
| Metric | Value |
|---|---|
| Median home value | $281,853 |
| Year-over-year change | +0.9% |
| Cheapest ZIP value | $199,459 |
| Most expensive ZIP value | $419,574 |
| Number of ZIPs analyzed | 5 |
| Data through | February 2026 |
| Metro area | College Station-Bryan, TX |
A 0.9% annual gain works out to roughly $2,500 in added value on the median home. That’s a thin margin. For a buyer, it means waiting another year probably won’t price you out. For a seller, it means appreciation alone won’t cover closing costs and agent fees if you turn around quickly.
The $419,574 ceiling reflects new construction on the city’s western edge in ZIP 77808. The $199,459 floor in ZIP 77803 keeps Bryan accessible — you can still find a typical house here for under $200,000, which is rare in Texas metros of this size.
Bryan Home Prices by Neighborhood
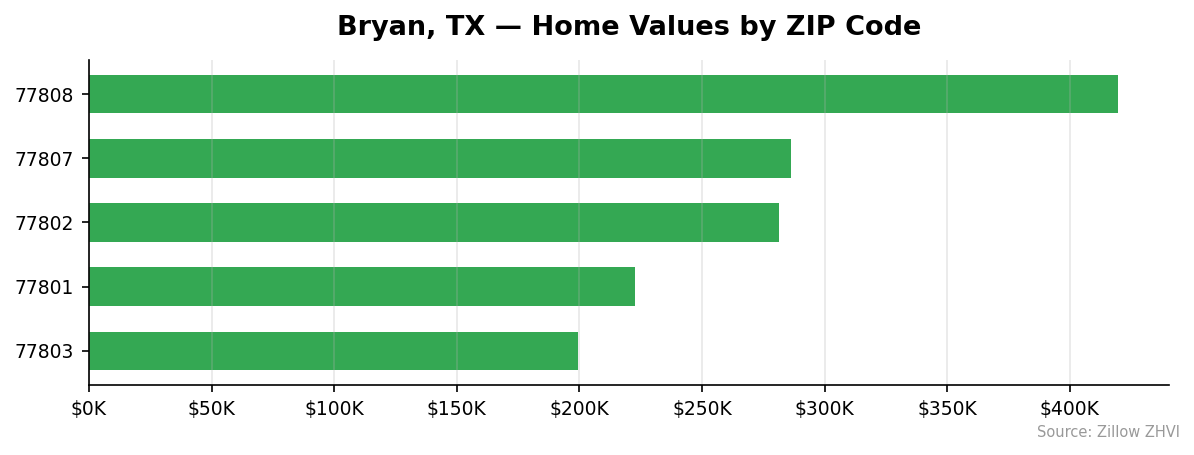
The five ZIPs split cleanly into three tiers: under $225K, around $280K, and over $400K.
| ZIP Code | Typical Home Value | Median Rent |
|---|---|---|
| 77803 | $199,459 | $1,504 |
| 77801 | $222,601 | $1,353 |
| 77802 | $281,207 | $1,278 |
| 77807 | $286,423 | $1,685 |
| 77808 | $419,574 | $1,933 |
Most Expensive
77808 — $419,574. This ZIP runs 49% above the city average, and rents follow at $1,933 a month — the highest in Bryan. Larger lot sizes and newer construction drive the premium.
77807 — $286,423. Just above the city median. Rent here is $1,685, suggesting a steady mix of owner-occupied and investor-held homes.
77802 — $281,207. Almost exactly at the city average, but the rent is the lowest of the five at $1,278. That gap between value and rent points to more long-time owners and fewer recent investor purchases.
Most Affordable
77803 — $199,459. The only Bryan ZIP under $200K. Rent is $1,504 — relatively high for the home value, which means the rent-to-price ratio favors landlords here.
77801 — $222,601. About 21% below the city average, with rent of $1,353. Older housing stock keeps purchase prices down.
77802 — $281,207. The third-cheapest is also the city median — proof that most of Bryan clusters in a tight middle band.
Rent vs Buy in Bryan
Median rents across Bryan’s ZIPs run from $1,278 in 77802 to $1,933 in 77808. The citywide weighted rent sits near $1,550 a month.
Now compare buying. A $281,853 home with 20% down ($56,371) and a 30-year mortgage at 7% costs about $1,500 a month in principal and interest. Add property taxes — Texas runs around 2% of assessed value — and you’re at $470 more. Insurance adds another $150. Total monthly carrying cost: roughly $2,120, before maintenance.
That’s $570 more than the average rent. The math gets worse if you put less than 20% down because of mortgage insurance.
| Cost Category | Renting | Buying (20% down) |
|---|---|---|
| Monthly housing payment | $1,550 | $2,120 |
| Upfront cost | First/last + deposit (~$3,100) | $56,371 down + closing |
| Builds equity | No | Yes |
Buying makes sense if you stay 5+ years and prices keep climbing at 1% or more annually. At Bryan’s current 0.9% pace, the appreciation barely covers transaction costs over a short hold. Renters who plan to leave within three years come out ahead.
Population Growth and Migration
Bryan added 7,183 residents between 2020 and 2024 — an 8.5% gain that outpaces most U.S. cities its size.
| Year | Population |
|---|---|
| 2020 | 84,358 |
| 2021 | 85,302 |
| 2022 | 88,095 |
| 2023 | 90,432 |
| 2024 | 91,541 |
The trend is steady. Each year added between 944 and 2,793 residents, with the largest jump between 2021 and 2022. By 2024, Bryan crossed 91,000 for the first time.
How does that compare to other Texas cities?
| City | 2024 Population | 4-Year Growth |
|---|---|---|
| Fort Worth | 1,008,106 | +9.1% |
| Bryan | 91,541 | +8.5% |
| San Antonio | 1,526,656 | +6.1% |
| Lubbock | 272,086 | +5.4% |
| Houston | 2,390,125 | +4.0% |
| Austin | 993,588 | +2.9% |
Bryan’s 8.5% growth sits second on this list, behind only Fort Worth and well ahead of Austin and Houston. That kind of inbound migration usually puts upward pressure on home prices. The fact that Bryan prices have only risen 0.9% in the past year suggests new housing supply is keeping pace with demand — for now.
Bryan Housing Market Trends
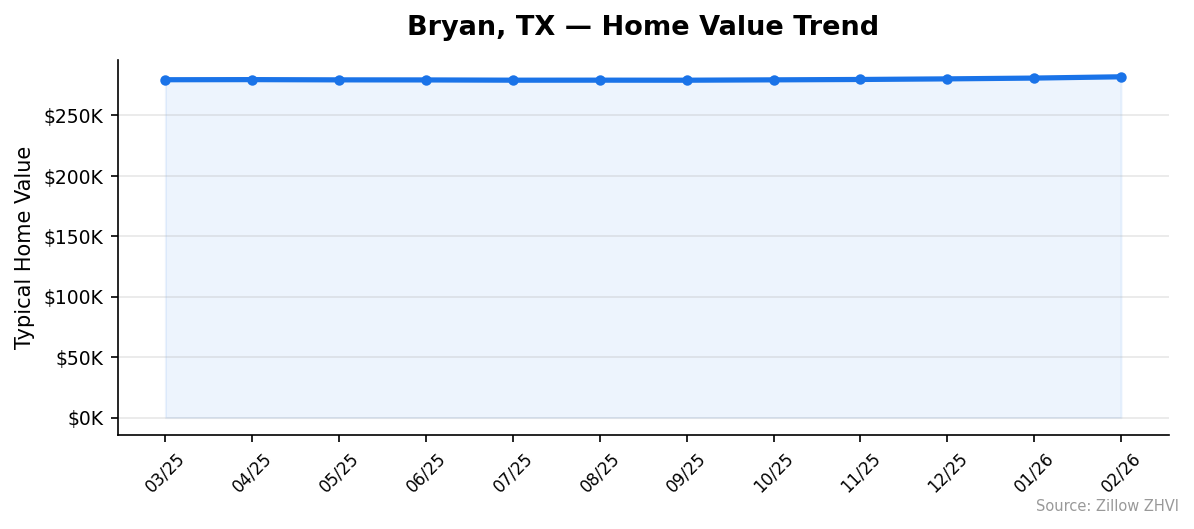
Twelve months of data show a market that drifted sideways, then ticked up.
| Month | Median Value |
|---|---|
| 2026-02 | $281,853 |
| 2026-01 | $280,784 |
| 2025-12 | $280,132 |
| 2025-11 | $279,633 |
| 2025-10 | $279,322 |
| 2025-09 | $279,027 |
| 2025-08 | $279,067 |
| 2025-07 | $279,047 |
| 2025-06 | $279,255 |
| 2025-05 | $279,309 |
| 2025-04 | $279,514 |
| 2025-03 | $279,419 |
From March 2025 through September 2025, the median bounced in a $500 range — essentially flat. Then prices began climbing every month from October through February, gaining about $2,500 over five months. The acceleration is real but small.
The $419,574 high-end ceiling has actually risen $6,383 over the same 12 months, while the $199,459 low-end floor dropped roughly $3,300 from its mid-2024 peak. The gap between Bryan’s cheapest and most expensive ZIPs is widening.
Is Bryan a Good Place to Buy in 2026?
The data suggests yes — with caveats.
Population growth of 8.5% over four years means real demand. Prices that rose only 0.9% during that period mean supply is keeping up. That’s an unusual and buyer-friendly combination for Texas.
Affordability is the strongest argument. At $281,853, the median Bryan home costs less than half the median in Austin and Houston metros. ZIP 77803 puts entry-level ownership under $200,000.
The case against: rent-to-buy economics don’t favor short-term ownership at current mortgage rates. If you plan to stay less than five years, renting wins. The slow appreciation means you’re not betting on big equity gains — you’re betting on stability.
For a buyer with a long horizon and a steady income, Bryan looks like one of the better-priced entry points in Texas right now. For a flipper or short-term investor, the numbers don’t work.
Bryan Housing Market Outlook for 2026-2027
The 5-month upward trend from October through February shows momentum. If the current pace continues, the median would clear $284,000 by mid-2026.
The 3-month trend — gains of roughly $500 a month — is more modest than the broader Texas market. That’s a feature, not a bug, for buyers worried about overpaying.
The widening spread between the cheapest and most expensive ZIPs hints at uneven market conditions. Premium areas are pulling away while the affordable end softens. Watch ZIP 77803 specifically — it’s the only Bryan ZIP where the typical value has fallen meaningfully off its peak.
If population keeps growing at 1.5% to 2% annually, demand will remain steady. New construction in 77808 should continue to absorb the upper end of demand without distorting prices in older neighborhoods.
Similar Markets in TX
- Houston — Bryan sits two hours up I-45 from Houston, where prices are higher but inventory is deeper.
- San Antonio — A larger metro with comparable affordability and slower price growth than Bryan.
- El Paso — Even cheaper than Bryan if you’re chasing the lowest entry price in Texas.
- Brownsville — Another sub-$300K Texas market, smaller and farther south.
- Spring — A Houston suburb with prices closer to Bryan’s range and similar growth dynamics.
Frequently Asked Questions
What is the average home price in Bryan?
The typical home in Bryan, TX is worth $281,853 as of February 2026. The number reflects the Zillow Home Value Index across five ZIPs, with prices ranging from $199,459 in 77803 to $419,574 in 77808.
Are home prices going up or down in Bryan?
Prices are up 0.9% year over year. The market gained ground in 11 of the last 12 months, with the strongest movement coming in the most recent five months — about $500 per month on the median.
Is it cheaper to rent or buy in Bryan?
Renting costs roughly $570 less per month than owning at current mortgage rates. Median rent sits near $1,550 a month while a 20%-down mortgage on the median home runs about $2,120 with taxes and insurance included.
What is the most affordable neighborhood in Bryan?
ZIP 77803 is the cheapest at $199,459 — about 29% below the city average. It’s the only Bryan ZIP where typical home values stay under $200,000.
Methodology
Home values are based on the Zillow Home Value Index (ZHVI), a smoothed measure of typical home values in the 35th to 65th percentile range. Rent estimates use the Zillow Observed Rent Index (ZORI). Population figures come from the U.S. Census Bureau Population Estimates Program (2020-2024 vintage). All datasets are publicly available. Housing data updated 2026-02-28.