Schaumburg Home Prices: $325K, Up 3.4% — 4 ZIPs Analyzed (2026)
$325,139. That’s the median home value in Schaumburg as of February 2026, up 3.4% from a year earlier. Prices have climbed every single month in the past 12-month window.
Quick answer: The average home price in Schaumburg, IL is $325,139 as of February 2026, up 3.4% year over year according to Zillow.
Current Home Prices in Schaumburg
The typical Schaumburg home is worth $325,139. That’s well below the Chicago metro’s pricier suburbs, but the gain over the past year has been steady rather than dramatic.
| Metric | Value |
|---|---|
| Median home value | $325,139 |
| Year-over-year change | +3.4% |
| Lowest ZIP value | $284,273 |
| Highest ZIP value | $353,806 |
| ZIPs analyzed | 4 |
| Data through | Feb 2026 |
The spread between the cheapest and most expensive ZIP is about $69,500. That’s a 24% gap from low to high — modest by Chicago-area standards, where some suburbs see 2x or 3x differences across ZIPs. Schaumburg is more uniform.
The 3.4% annual gain works out to roughly $10,600 added to the median over 12 months. For a buyer who waited a year, that’s a meaningful cost increase, though not the double-digit jumps some metros saw in 2021 and 2022.
You’re looking at a market that’s appreciating quietly. No fireworks, no crashes — just steady upward pressure.
Schaumburg Home Prices by Neighborhood
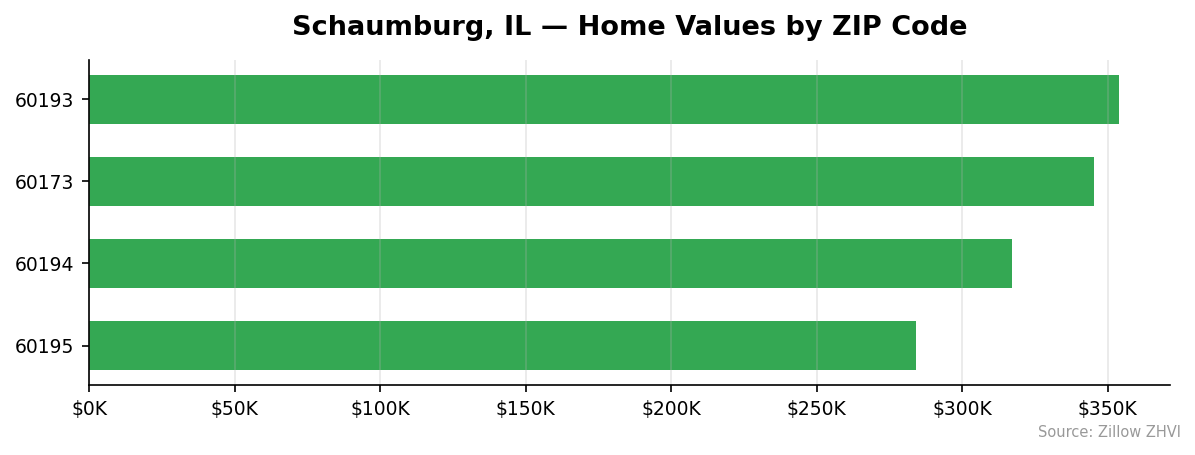
Four ZIP codes make up the local market data. Here’s how they compare.
| ZIP | Median Value | Vs. City Median | Avg Rent |
|---|---|---|---|
| 60193 | $353,806 | +8.8% | $2,028 |
| 60173 | $345,305 | +6.2% | $2,125 |
| 60194 | $317,172 | -2.5% | $2,273 |
| 60195 | $284,273 | -12.6% | $1,892 |
Most Expensive
- 60193 — $353,806. The priciest Schaumburg ZIP, sitting nearly 9% above the city median. Rent here is mid-pack at $2,028.
- 60173 — $345,305. Just behind 60193. Its $2,125 average rent suggests stronger rental demand relative to home price.
- 60194 — $317,172. Below the city median on price, but the highest rents in town at $2,273. That’s an interesting split — cheaper to buy, more expensive to rent.
Most Affordable
- 60195 — $284,273. The cheapest ZIP by a wide margin, roughly $69K below 60193. Rent is also lowest here at $1,892.
- 60194 — $317,172. Second-cheapest by purchase price, but with the area’s highest rent. Buyers may find better value here than renters.
- 60173 — $345,305. Not technically affordable — but the rent-to-price ratio looks favorable for landlords.
Rent vs Buy in Schaumburg
Average rent across Schaumburg’s four ZIPs runs $2,079 per month. That’s $24,948 a year against a $325,139 median price.
The price-to-rent ratio comes out to roughly 13. As a rule of thumb, ratios below 15 lean toward buying being the better long-term move, while ratios above 20 favor renting. Schaumburg sits firmly in buy-friendly territory by that measure.
Per-ZIP breakdown:
| ZIP | Home Value | Avg Rent | Price-to-Rent |
|---|---|---|---|
| 60193 | $353,806 | $2,028 | 14.5 |
| 60173 | $345,305 | $2,125 | 13.5 |
| 60194 | $317,172 | $2,273 | 11.6 |
| 60195 | $284,273 | $1,892 | 12.5 |
ZIP 60194 stands out. At a 11.6 ratio, it’s the most buy-friendly area on paper. Rents there are 12% above 60195’s, but home prices are only 11.6% higher. The math tilts toward ownership.
These figures don’t include property taxes (Illinois runs high — often 2% of assessed value), insurance, or maintenance. Plug in those costs and renting becomes more competitive month-to-month. But over 7+ years, the ratios above suggest buying still wins for most households.
Schaumburg Housing Market Trends
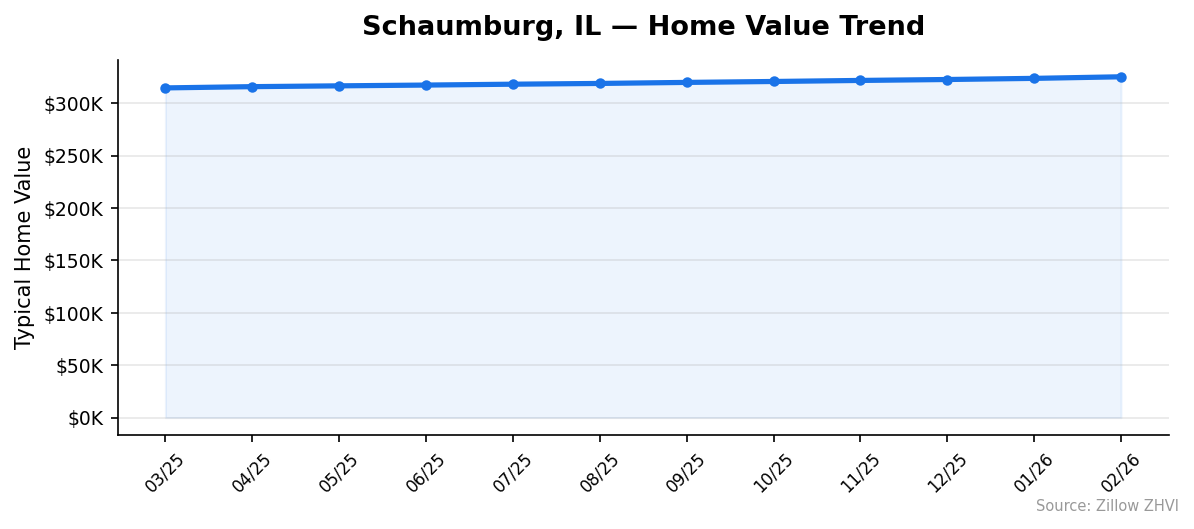
Twelve straight months of price gains. Here’s the monthly trend.
| Month | Median | Min ZIP | Max ZIP |
|---|---|---|---|
| Feb 2026 | $325,139 | $284,273 | $353,806 |
| Jan 2026 | $323,633 | $283,036 | $352,250 |
| Dec 2025 | $322,548 | $282,461 | $350,789 |
| Nov 2025 | $321,661 | $282,520 | $349,083 |
| Oct 2025 | $320,660 | $282,593 | $347,068 |
| Sep 2025 | $319,778 | $283,126 | $345,136 |
| Aug 2025 | $318,792 | $283,502 | $343,049 |
| Jul 2025 | $318,072 | $283,850 | $341,578 |
| Jun 2025 | $317,239 | $283,612 | $340,018 |
| May 2025 | $316,499 | $282,993 | $338,836 |
| Apr 2025 | $315,734 | $282,446 | $337,424 |
| Mar 2025 | $314,541 | $281,418 | $335,865 |
The pattern is unusually clean. Each month posts a higher median than the one before it. No reversals, no flat patches. The recent 3-month gain (Dec 2025 → Feb 2026) was about $2,591, or roughly 0.8%.
The cheapest ZIP (60195) has been remarkably stable, hovering between $281K and $284K all year. Most of the appreciation has come from the higher-priced ZIPs. The max value rose from $335,865 to $353,806 — a $17,941 gain, or about 5.3%.
That tells you something. Buyers in the upper end of Schaumburg’s market have been pushing prices up faster than entry-level buyers.
Is Schaumburg a Good Place to Buy in 2026?
The data points to a seller’s market, but a calm one. Twelve months of consecutive gains, a 3.4% annual rise, and no signs of a pullback in the recent monthly numbers.
For buyers, that means waiting probably costs you. Each month of delay added roughly $880 to the median price over the past year. If you’re financing, rising prices stack with whatever rate environment you face.
For sellers, conditions look solid. There’s no crash signal in this data. Demand is keeping prices firm, and the higher-end ZIPs are driving the most appreciation.
If you want value, focus on 60195 ($284K) or 60194 ($317K). If you want stronger appreciation, the upper ZIPs (60193, 60173) have been pulling more weight on the price gains.
A 13.0 price-to-rent ratio is also a green flag for owner-occupants. You’re not paying a renting-is-better premium to buy here.
Schaumburg Housing Market Outlook for 2026-2027
The 3-month trend suggests prices keep moving up at roughly $850 to $900 per month. If that pace continues through summer, the median would clear $328K by mid-2026.
There’s no deceleration in the data. The most recent month-over-month gain (Jan to Feb 2026) was $1,506 — slightly above the 12-month average. Momentum is intact, not fading.
The upper end of the market is doing more of the lifting. If that pattern holds, expect the spread between Schaumburg’s cheapest and most expensive ZIPs to widen further over the next 6 months.
A national rate cut or recession would change the picture quickly. But based purely on the trajectory in this dataset, the next several months should look a lot like the past 12 — gradual, broad-based gains.
Similar Markets in IL
- Naperville — a higher-priced western suburb worth checking if Schaumburg’s upper ZIPs feel tight on inventory.
- Aurora — typically more affordable than Schaumburg and a common alternative for budget-conscious buyers in the metro.
- Elgin — another lower-priced northwest suburb option for buyers willing to commute farther.
- Evanston — a pricier North Shore alternative if proximity to Chicago matters more than cost.
- Chicago — the metro core, with broader ZIP variation than any single suburb can offer.
Frequently Asked Questions
What is the average home price in Schaumburg?
The average home price in Schaumburg, IL is $325,139 as of February 2026. Across four ZIP codes, values range from $284,273 in 60195 to $353,806 in 60193.
Are home prices going up or down in Schaumburg?
Prices are up 3.4% year over year. The trend data shows 12 consecutive months of gains, with the median climbing from $314,541 in March 2025 to $325,139 in February 2026.
Is it cheaper to rent or buy in Schaumburg?
Average rent runs $2,079 per month against a $325,139 median home value, producing a price-to-rent ratio near 13. That ratio favors buying over the long term, though monthly costs (taxes, insurance, maintenance) can tilt toward renting in the short run.
What is the most affordable neighborhood in Schaumburg?
ZIP 60195 is the most affordable at $284,273, roughly 13% below the city median. It also carries the lowest rent of the four ZIPs at $1,892 per month.
Methodology
Home values are based on the Zillow Home Value Index (ZHVI), a smoothed measure of typical home values in the 35th to 65th percentile range. Rent estimates use the Zillow Observed Rent Index (ZORI). Population figures come from the U.S. Census Bureau Population Estimates Program (2020-2024 vintage). All datasets are publicly available. Housing data updated 2026-02-28.