Cheyenne Home Prices: $380K, Up 3.6% — 3 ZIPs Analyzed (2026)
$379,595. That’s the typical home value in Cheyenne as of February 2026. Prices climbed 3.6% over the past year, defying the cooling pattern showing up in some western markets.
Quick answer: The average home price in Cheyenne, WY is $379,595 as of February 2026, up 3.6% year over year according to Zillow.
Current Home Prices in Cheyenne
Cheyenne sits in the affordable end of the western market. The typical home costs $379,595, which is roughly $80,000 below the U.S. median for the same period. Prices have moved in one direction for a year — up.
| Metric | Value |
|---|---|
| Median home value | $379,595 |
| Year-over-year change | +3.6% |
| Lowest ZIP average | $316,610 |
| Highest ZIP average | $481,886 |
| ZIPs analyzed | 3 |
| Data through | February 2026 |
The spread between the cheapest and priciest ZIP is $165,276. That’s a 52% gap from bottom to top, which is wide for a city of this size. It tells you that location matters more than headline averages suggest. A buyer with a fixed budget will see very different houses depending on which side of town they shop.
The 3.6% annual gain works out to about $13,000 added to the typical home’s value over the last 12 months. For owners, that’s quiet equity. For buyers, it’s a moving target.
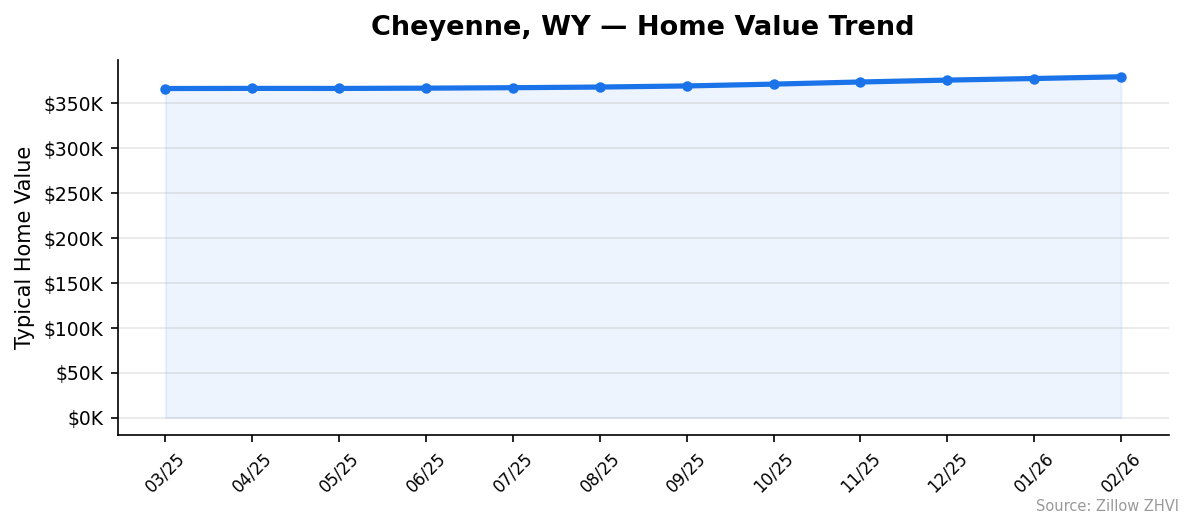
Cheyenne’s appreciation is steady rather than dramatic. The monthly trend shows roughly $1,000 to $2,000 in added value each month since spring 2025. No single month spiked. No single month dropped. That kind of slow climb usually points to underlying demand rather than speculation.
Cheyenne Home Prices by Neighborhood
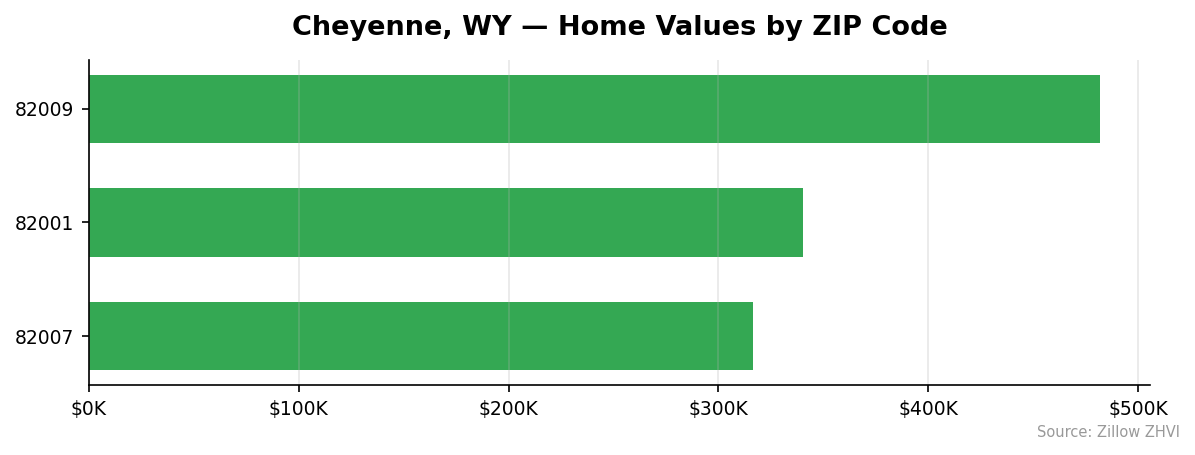
Three ZIPs cover Cheyenne. The values diverge sharply.
| ZIP | Avg Home Value | Avg Rent |
|---|---|---|
| 82009 | $481,886 | $1,761 |
| 82001 | $340,289 | $1,364 |
| 82007 | $316,610 | $1,564 |
Most Expensive
82009 leads the city at $481,886, or 27% above the citywide average. Rents in this ZIP run $1,761 — the highest in town — which lines up with the home values. This is where the priciest housing stock sits.
82001 comes in second at $340,289. It’s actually below the city average despite being the central downtown ZIP. Rents here are the lowest at $1,364.
82007 rounds out the trio at $316,610, the cheapest.
Most Affordable
82007 is the most affordable buy in Cheyenne at $316,610, but its rent of $1,564 is higher than 82001’s. That makes 82007 an unusual pocket: cheaper to buy, more expensive to rent than the downtown ZIP.
82001 offers the lowest rents in the city at $1,364 per month, which makes it the better play for renters.
82009 is not affordable by any measure here — it’s the priciest on both counts.
Rent vs Buy in Cheyenne
The average rent across Cheyenne’s three ZIPs is roughly $1,563 per month. The math on buying tells a different story.
A mortgage on the median home at $379,595 — assuming 20% down and a 7% rate — runs about $2,021 per month for principal and interest alone. Add property taxes and insurance, and the monthly cost climbs closer to $2,400.
That’s a gap of about $840 per month between renting and owning the typical home. Over a year, that’s roughly $10,000 in extra cash outflow if you buy.
The trade-off is equity. With 3.6% annual appreciation, the median home gained about $13,000 in value over the past year. That offsets the higher monthly cost — on paper. In practice, the gap matters most for buyers who plan to move within a few years, since closing costs and selling fees can wipe out short-term appreciation.
For renters who plan to stay put, the cheapest combination is renting in 82001 at $1,364 per month. For buyers who want the lowest entry price, 82007 at $316,610 is the floor.
Population Growth and Migration
Cheyenne is growing, just barely. The Census Bureau estimates the city’s population at 65,704 in 2024, up from 65,283 in 2020 — a four-year gain of 0.6%.
| Year | Population |
|---|---|
| 2020 | 65,283 |
| 2021 | 65,151 |
| 2022 | 64,668 |
| 2023 | 65,287 |
| 2024 | 65,704 |
The trajectory is interesting. Cheyenne lost residents from 2020 through 2022, bottoming at 64,668. Then it bounced back, adding more than 1,000 residents over the next two years. The 2024 figure is the highest in the five-year window.
| City | 2024 Population | 4-Year Change |
|---|---|---|
| Cheyenne | 65,704 | +0.6% |
| Casper | 58,823 | -0.8% |
Compared to Casper, Wyoming’s other mid-sized city, Cheyenne is doing better. Casper lost residents over the same four years. Cheyenne gained.
For housing, even slow growth supports prices. New residents need somewhere to live. With only three ZIPs and a small overall housing stock, even modest demand pressure can move values. The 3.6% annual price gain you see in the data fits with a city adding people rather than losing them.
Cheyenne Housing Market Trends
The 12-month trend shows steady, unbroken appreciation.
| Month | Average Value |
|---|---|
| Mar 2025 | $366,530 |
| Apr 2025 | $366,671 |
| May 2025 | $366,615 |
| Jun 2025 | $366,934 |
| Jul 2025 | $367,449 |
| Aug 2025 | $368,165 |
| Sep 2025 | $369,395 |
| Oct 2025 | $371,423 |
| Nov 2025 | $373,803 |
| Dec 2025 | $375,907 |
| Jan 2026 | $377,669 |
| Feb 2026 | $379,595 |
From March 2025 to February 2026, values added $13,065 — a 3.6% gain over 12 months. There was no monthly drop in the entire stretch.
The pace also accelerated late in the year. The April-to-July 2025 stretch was nearly flat, with prices barely moving. Then growth picked up. Between August 2025 and February 2026, values jumped $11,430 in just six months.
That second-half acceleration is the more important number. If the recent pace held — about $1,900 per month — the annualized rate would be closer to 6%, not 3.6%. Whether that holds depends on what comes next.
Is Cheyenne a Good Place to Buy in 2026?
The data points to a seller’s market, but a calm one. Prices have risen for 12 straight months. Inventory pressure is implied by the steady appreciation — if supply outpaced demand, the line would have flattened or dipped.
For buyers, the case to act now rests on two facts. Prices have not stopped going up. And the recent monthly pace is faster than the 12-month average, suggesting the climb may continue.
The case to wait is thinner. There’s no sign of a pullback in the trend data. Mortgage rates remain the variable that could change the math more than local conditions.
For sellers, conditions favor listing. Values are at a 12-month high in February 2026. Days-on-market data isn’t included here, but the price trajectory tells you demand is meeting or exceeding supply.
The biggest call buyers face is which ZIP. The 52% spread between 82007 and 82009 means the same budget buys very different homes. ZIP 82001’s combination of low rents and below-average home values makes it the most balanced choice. ZIP 82007 offers the lowest entry price for buyers willing to accept its higher rent-to-value ratio.
Cheyenne Housing Market Outlook for 2026-2027
The 3-month trend suggests continued price gains. Values rose from $373,803 in November 2025 to $379,595 in February 2026 — a $5,792 increase in three months.
If the current pace continues, Cheyenne could cross $385,000 by mid-2026 and approach $390,000 by year end. That assumes nothing changes in the underlying demand pattern.
The acceleration in the second half of 2025 is the signal worth watching. Six straight months of faster gains usually means tighter supply, stronger demand, or both. If that pattern persists into spring 2026 — typically the busiest selling season — appreciation could pull ahead of the 3.6% annual figure.
The risk to this outlook is a rate-driven slowdown. The local data here doesn’t capture interest rate moves or national policy shifts. What it does show is a market that has not paused in 12 months.
Similar Markets in WY
If you’re shopping Wyoming, two other cities have data worth comparing:
- Casper — Wyoming’s second-largest city, with population shrinking by 0.8% since 2020. Compare its market data to see whether slower growth means slower price gains.
- Sheridan — A smaller northern Wyoming market. Often priced differently from the southeastern corner around Cheyenne.
Cheyenne buyers who find prices stretching their budget might check Casper, where slower population trends could mean softer pricing. Buyers who want a smaller-town feel could look at Sheridan.
Frequently Asked Questions
What is the average home price in Cheyenne?
The average home price in Cheyenne, WY is $379,595 as of February 2026, based on the Zillow Home Value Index. That figure spans three ZIP codes, with values ranging from $316,610 in 82007 to $481,886 in 82009.
Are home prices going up or down in Cheyenne?
Prices are up 3.6% year over year, with appreciation in every one of the past 12 months. The pace has actually accelerated since August 2025, with values rising about $1,900 per month in the second half of the year.
Is it cheaper to rent or buy in Cheyenne?
Renting is cheaper monthly. The average rent runs about $1,563 across Cheyenne’s three ZIPs, while a mortgage on the median home with 20% down at 7% costs roughly $2,021 per month before taxes and insurance — a gap of about $460 to $840 depending on what you add for escrow.
What is the most affordable neighborhood in Cheyenne?
ZIP 82007 is the cheapest, with a typical home value of $316,610. That’s $63,000 below the citywide average and $165,276 less than the priciest ZIP at 82009.
Methodology
Home values are based on the Zillow Home Value Index (ZHVI), a smoothed measure of typical home values in the 35th to 65th percentile range. Rent estimates use the Zillow Observed Rent Index (ZORI). Population figures come from the U.S. Census Bureau Population Estimates Program (2020-2024 vintage). All datasets are publicly available. Housing data updated 2026-02-28.