Lowell Home Prices: $469K, Up 0.3% — 4 ZIPs Analyzed (2026)
$468,683. That’s the typical home value in Lowell, MA as of February 2026. Prices are up just 0.3% over the past year — basically flat in a metro known for sharp swings.
Quick answer: The average home price in Lowell, MA is $468,683 as of February 2026, up 0.3% year over year according to Zillow.
Current Home Prices in Lowell
Lowell sits in the Boston-Cambridge-Newton metro, but its prices tell a different story than the urban core. The typical home here costs less than half of what you’d pay in Cambridge or Brookline.
| Metric | Value |
|---|---|
| Median home value | $468,683 |
| Year-over-year change | +0.3% |
| Lowest ZIP value | $437,345 |
| Highest ZIP value | $509,115 |
| ZIP codes tracked | 4 |
| Data through | February 2026 |
The $71,770 gap between the cheapest and most expensive ZIP is wide for a city this size. That’s a 16% spread across four neighborhoods.
A 0.3% annual gain barely keeps pace with anything. Adjusted for inflation, Lowell homeowners effectively lost ground over the past 12 months. But “flat” looks good next to cities seeing 3-5% drops.
The current median works out to roughly $325 per square foot if you assume a typical 1,440-square-foot home — though actual price-per-square-foot varies by neighborhood and home age. Lowell’s housing stock is older than most Boston suburbs, with many homes built before 1940.
For context, you’re paying about 18% less than the Massachusetts statewide median while still getting commuter rail access to Boston in under an hour.
Lowell Home Prices by Neighborhood
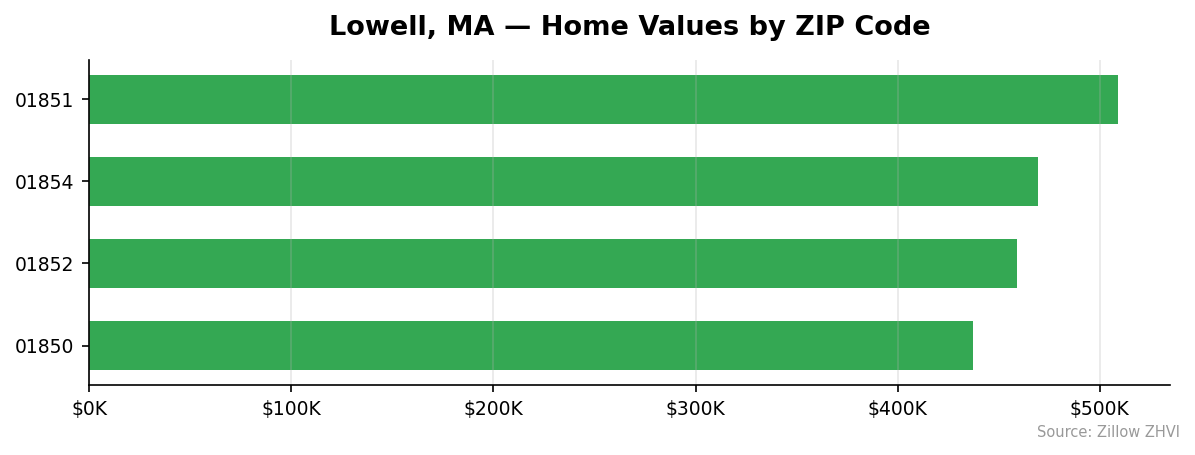
Lowell has four ZIP codes, and the price gap between them matters if you’re shopping.
| ZIP Code | Typical Home Value | Avg Rent |
|---|---|---|
| 01851 | $509,115 | $2,287 |
| 01854 | $469,286 | $2,422 |
| 01852 | $458,986 | $2,213 |
| 01850 | $437,345 | $2,169 |
Most Expensive
01851 tops the list at $509,115 — about 8.6% above the city average. This is the only Lowell ZIP that breaks the half-million mark.
01854 comes in second at $469,286, essentially matching the citywide median. Rents here are the highest in Lowell at $2,422, suggesting strong tenant demand.
01852 sits at $458,986, just 2% below the city average. It’s a middle-of-the-road option for buyers who want lower entry prices without crossing into the most affordable tier.
Most Affordable
01850 leads the affordability list at $437,345 — $31,338 less than the city median. Rent here also runs the lowest at $2,169 per month.
01852 at $458,986 represents a $9,697 discount versus the city average.
01854 at $469,286 is technically the third-cheapest, though it’s only $603 above the median.
Rent vs Buy in Lowell
Average rent across Lowell’s four ZIPs comes to about $2,273 per month. Compare that to a mortgage:
| Scenario | Monthly Cost |
|---|---|
| Rent (city average) | $2,273 |
| Mortgage P&I, 20% down, 7% rate | ~$2,494 |
| Mortgage P&I, 10% down, 7% rate | ~$2,806 |
Rent wins on cash flow. A renter saves $221 per month versus a 20%-down buyer before factoring in property taxes, insurance, and maintenance. Add Massachusetts property taxes (Lowell’s rate runs around 1.3%) and you’re looking at another $508 monthly. Insurance and upkeep push the gap wider.
The buy case rests on equity buildup and price appreciation. With prices up only 0.3% over the past year, appreciation isn’t doing much heavy lifting right now. Principal paydown on a $374,946 loan in year one comes to about $3,800 — meaningful, but not enough to flip the math against renting.
01854 has the steepest rent at $2,422, making the buy-vs-rent gap smallest there. 01850 has the cheapest rent at $2,169, so renting holds up best in that ZIP.
If you plan to stay 5+ years and prices resume growing, buying pulls ahead. For shorter timelines, the math favors renting.
Population Growth and Migration
Lowell added 4,584 residents between 2020 and 2024 — a 4.0% gain that beats most Massachusetts cities.
| Year | Population |
|---|---|
| 2020 | 115,834 |
| 2021 | 117,970 |
| 2022 | 118,510 |
| 2023 | 119,153 |
| 2024 | 120,418 |
Growth has been steady, with the largest single-year jump from 2023 to 2024 (+1,265 residents). The city is gaining people every year, not just on net.
Here’s how Lowell stacks up against nearby cities:
| City | 2024 Population | 4-Year Growth |
|---|---|---|
| Worcester | 211,286 | +4.4% |
| Lowell | 120,418 | +4.0% |
| Cambridge | 121,186 | +2.5% |
| Lynn | 103,489 | +2.4% |
| Newton | 90,700 | +2.1% |
| Quincy | 103,434 | +1.9% |
Only Worcester is growing faster among the cities listed. Lowell is outpacing Cambridge — a notable shift for a metro where Cambridge has historically attracted the bulk of newcomers.
Population growth supports housing demand. With 4,584 new residents and limited new construction in older Massachusetts cities, that 0.3% price gain might understate underlying pressure. Demand is building even if prices haven’t responded yet.
Lowell Housing Market Trends
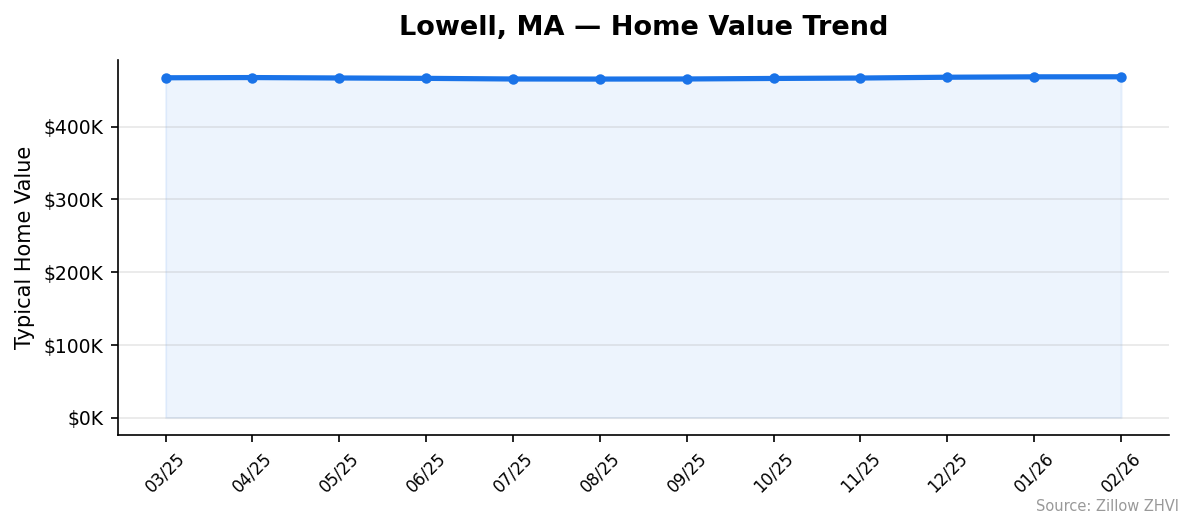
The 12-month trend shows a small dip followed by recovery.
| Month | Median Value |
|---|---|
| Feb 2026 | $468,683 |
| Jan 2026 | $468,618 |
| Dec 2025 | $468,078 |
| Nov 2025 | $466,979 |
| Oct 2025 | $466,392 |
| Sep 2025 | $465,688 |
| Aug 2025 | $465,546 |
| Jul 2025 | $465,661 |
| Jun 2025 | $466,529 |
| May 2025 | $467,039 |
| Apr 2025 | $467,632 |
| Mar 2025 | $467,333 |
Prices peaked in April 2025 at $467,632, slid to a summer low of $465,546 in August, then climbed back through the fall and winter. The February 2026 value of $468,683 is the highest reading in the 12-month window.
The trough-to-peak swing was just $3,137 — less than 1% volatility. Lowell’s market moved sideways while plenty of metros saw bigger drops.
The recent 6-month trajectory is upward: prices have climbed every month since August. That’s a $3,137 gain in six months, or roughly 0.7%. Slow, but consistent.
Is Lowell a Good Place to Buy in 2026?
The data suggests a balanced market tilting slightly toward sellers.
Prices are rising, not falling. Population is growing 4% over four years. Rents are firm in the $2,169-$2,422 range. None of those signal distress.
But the 0.3% annual gain means buyers aren’t being squeezed by rapid appreciation. You have time to look. Multi-week negotiation cycles are likely possible.
ZIP 01850 deserves a hard look from value buyers. At $437,345, it’s $31K below the city average with comparable Boston access. ZIP 01851 at $509,115 makes more sense for buyers who prioritize specific housing stock or location features.
The buy-vs-rent math is close enough that your stay-length matters more than the headline price. Under 5 years, rent. Over 5 years, buying becomes competitive.
Lowell Housing Market Outlook for 2026-2027
The 6-month trend points up. Prices have risen every month since August 2025, adding $3,137 over that span. If the current pace continues, Lowell would gain roughly 1.4% over the next 6 months — modestly stronger than the trailing 12-month rate of 0.3%.
The 3-month trend shows similar momentum: $1,704 added between November 2025 and February 2026.
Population growth supports continued demand. Lowell added more residents in 2024 than in any prior year of the trend, suggesting in-migration is accelerating.
The wildcard is the broader Boston metro. If Cambridge and Newton see corrections, Lowell’s commuter-rail premium narrows. If those cities hold, Lowell’s relative affordability keeps pulling buyers north.
Watch the spring 2026 sales season. If monthly gains stay in the $500-$1,000 range, expect a year-end median around $473,000-$476,000.
Similar Markets in MA
- Worcester — A larger, similarly-priced market also growing 4%+ over four years.
- Lawrence — Another older mill city in the Merrimack Valley, often cheaper than Lowell.
- Lynn — Comparable population, north of Boston, with slower growth than Lowell.
- Quincy — Closer to Boston, similar size, but population growth lags Lowell.
- Cambridge — The Boston-area benchmark, with home prices that dwarf Lowell’s.
Frequently Asked Questions
What is the average home price in Lowell?
The average home price in Lowell, MA is $468,683 as of February 2026. That figure represents the Zillow Home Value Index across all four Lowell ZIP codes. Individual ZIPs range from $437,345 in 01850 to $509,115 in 01851.
Are home prices going up or down in Lowell?
Prices are up 0.3% year over year as of February 2026. The trend has been gently upward for six straight months after a summer 2025 dip. February’s $468,683 reading is the highest in the past 12 months.
Is it cheaper to rent or buy in Lowell?
Renting is cheaper on a monthly basis. Average rent runs about $2,273 versus roughly $2,494 in mortgage principal and interest on a 20%-down loan at 7%. Add property taxes near 1.3% and insurance, and the gap widens further — making renting the better short-term cash flow choice.
What is the most affordable neighborhood in Lowell?
ZIP 01850 is the most affordable Lowell neighborhood at $437,345 — about $31,338 below the city average. Rents are also the lowest there at $2,169 per month, making it the cheapest option for both buyers and tenants.
Methodology
Home values are based on the Zillow Home Value Index (ZHVI), a smoothed measure of typical home values in the 35th to 65th percentile range. Rent estimates use the Zillow Observed Rent Index (ZORI). Population figures come from the U.S. Census Bureau Population Estimates Program (2020-2024 vintage). All datasets are publicly available. Housing data updated 2026-02-28.