Omaha Home Prices: $290K, Up 1.1% — 31 ZIPs Analyzed (2026)
$289,795. That’s the typical home value in Omaha, NE as of February 2026. Prices are up 1.1% over the past year, and the trend has accelerated — values have risen every month since last summer.
Quick answer: The average home price in Omaha, NE is $289,795 as of February 2026, up 1.1% year over year according to Zillow.
Current Home Prices in Omaha
Omaha sits well below the national median. The city’s typical home value is roughly half what you’d pay in coastal metros, and the spread between the cheapest and most expensive ZIPs is wide.
| Metric | Value |
|---|---|
| Median home value | $289,795 |
| Year-over-year change | +1.1% |
| Cheapest ZIP value | $132,812 |
| Priciest ZIP value | $504,398 |
| ZIPs analyzed | 31 |
| Data through | Feb 2026 |
The 1.1% annual gain is modest. But it’s positive — and that puts Omaha in a different category than markets like Austin or Phoenix, where values have been falling. The price floor here is unusual: you can still find a typical home in 68111 for under $135K, while 68022 in the western suburbs tops $504K. That’s a 3.8x gap inside one metro.
The data shows Omaha behaves more like a steady mid-sized market than a boom-bust city. The cheapest ZIP gained about $400 over the year. The priciest gained about $4,000. Most of the appreciation has clustered in the last six months, which suggests buyer activity picked up heading into spring 2026.
For context: a 1.1% gain on a $289,795 home is about $3,200 in equity over twelve months. That barely keeps pace with property taxes in many counties.
Omaha Home Prices by Neighborhood
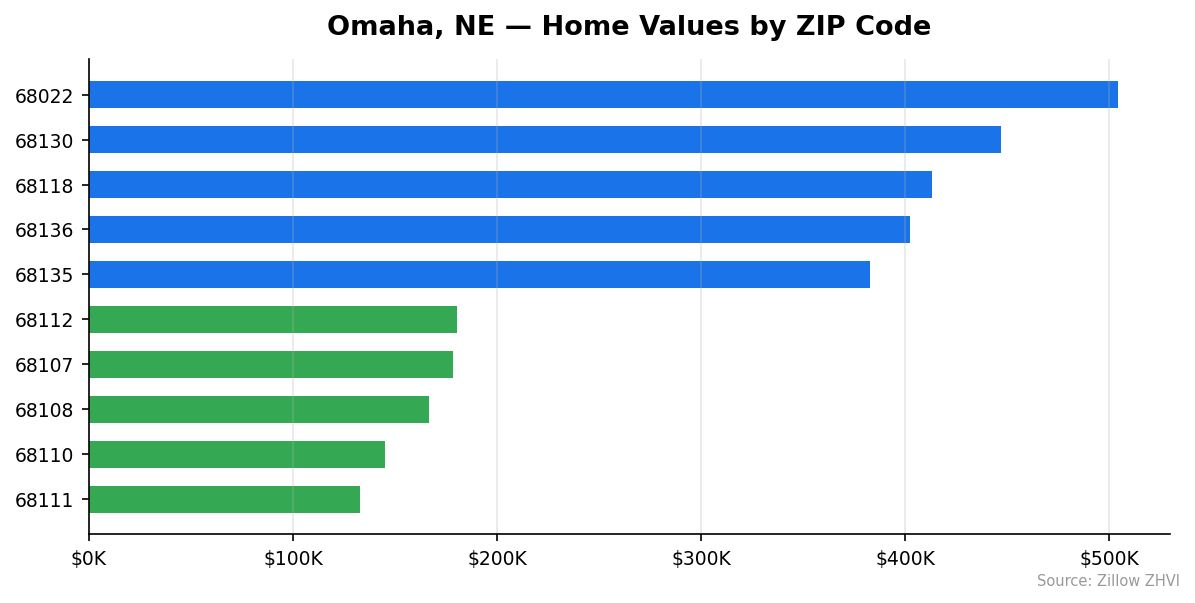
Omaha breaks down into 31 ZIPs with a wide price spread. The west and southwest suburbs anchor the top of the market. North and east Omaha — particularly inside the I-680 loop — hold the most affordable inventory.
| ZIP | Median value | Median rent |
|---|---|---|
| 68022 | $504,398 | $1,728 |
| 68130 | $447,061 | $1,507 |
| 68118 | $413,157 | $1,551 |
| 68136 | $402,375 | $1,699 |
| 68135 | $382,562 | $1,744 |
| 68116 | $372,977 | $1,642 |
| 68142 | $365,283 | — |
| 68154 | $349,079 | $1,227 |
| 68132 | $349,809 | $1,314 |
| 68124 | $333,938 | $1,788 |
| 68152 | $329,339 | — |
| 68144 | $304,561 | $1,218 |
| 68114 | $300,139 | $1,301 |
| 68102 | $288,153 | $1,329 |
| 68157 | $288,067 | — |
| 68138 | $287,015 | $1,479 |
| 68164 | $286,120 | $1,283 |
| 68122 | $280,433 | — |
| 68137 | $278,343 | $1,548 |
| 68127 | $276,941 | $1,103 |
| 68134 | $252,192 | $1,093 |
| 68106 | $246,192 | $1,774 |
| 68105 | $219,957 | $1,228 |
| 68131 | $214,177 | $1,516 |
| 68117 | $214,050 | — |
| 68104 | $194,131 | $1,416 |
| 68112 | $180,437 | — |
| 68107 | $178,469 | $999 |
| 68108 | $166,511 | $1,240 |
| 68110 | $144,972 | — |
| 68111 | $132,812 | $1,422 |
Most Expensive
- 68022 — $504,398. Elkhorn area on the western edge of the metro. Newer construction, larger lots, and rents around $1,728 reflect a market geared toward buyers rather than renters.
- 68130 — $447,061. Far west Omaha, including parts of the 192nd Street corridor. Median rent of $1,507 puts the rent-to-price ratio low — this is a buy market.
- 68118 — $413,157. Another western suburb cluster. Rents at $1,551 mirror 68022 but at a lower entry price.
Most Affordable
- 68111 — $132,812. North Omaha, the cheapest ZIP in the city — about 54% below the median. Rent here is $1,422, which is unusually high relative to the home value, signaling investor activity.
- 68110 — $144,972. Eppley Airfield area, mostly industrial-adjacent housing. Rent data isn’t available for this ZIP.
- 68108 — $166,511. South Omaha near the stockyards. Rents run about $1,240, leaving a tight gap between rent and a likely mortgage payment.
Rent vs Buy in Omaha
Renting wins in most Omaha ZIPs right now. The math depends heavily on where you look.
Citywide, rents range from $999 (68107) to $1,788 (68124). The median across ZIPs with rent data sits roughly in the $1,400-$1,500 range. Compare that to the cost of buying: a $289,795 home with 20% down ($57,959) leaves a $231,836 loan. At current 30-year rates, the principal and interest alone runs about $1,500-$1,600 per month. Add property taxes (Nebraska’s effective rate is among the higher ones nationally), insurance, and maintenance, and the all-in monthly cost lands closer to $2,000-$2,200.
That’s a $500-$700 monthly premium over renting in most ZIPs.
Where the math flips: cheaper north and east Omaha ZIPs. In 68111, a home costs $132,812. A 20% down purchase ($26,562 down, $106,250 loan) runs about $700-$800 in principal and interest, plus another $300-$400 in taxes and insurance — roughly $1,000-$1,200 monthly. That’s below the $1,422 median rent in the same ZIP. Buying makes financial sense here if you can swing the down payment.
In the western suburbs, the picture reverses sharply. ZIP 68130 has a $447,061 median home value but rents at only $1,507. That’s a rent-to-price ratio of about 0.34% per month — well below the 1% rule investors use as a benchmark. Renting in west Omaha is a clear value if your job doesn’t require ownership.
Population Growth and Migration
Omaha’s population has been mostly flat for five years. The city had 492,783 residents in 2020 and 489,265 in 2024 — a net loss of about 3,500 people, or 0.7%.
| Year | Population |
|---|---|
| 2020 | 492,783 |
| 2021 | 488,727 |
| 2022 | 486,666 |
| 2023 | 486,780 |
| 2024 | 489,265 |
The trend shows three years of decline followed by two years of slight recovery. The 2024 figure is about 2,500 above the 2022 low. That’s not growth in any meaningful sense — but it’s no longer shrinking either.
Compare with other Nebraska cities:
| City | 2024 Population | 4-year Change |
|---|---|---|
| Omaha | 489,265 | -0.7% |
| Lincoln | 300,619 | +3.0% |
| Bellevue | 64,777 | -0.6% |
| Grand Island | 53,250 | +0.4% |
Lincoln is the standout. The capital grew 3% over four years while Omaha treaded water. Bellevue, an Omaha suburb, shows a similar pattern to the central city. That points to slow population shift within the metro — out to more distant suburbs and to Lincoln — rather than people leaving Nebraska entirely.
For housing demand, flat population means new construction must be matched closely to actual need. Oversupply risk is real in markets that aren’t growing. The fact that home values are still rising 1.1% suggests demand isn’t collapsing — but it also doesn’t have a strong tailwind.
Omaha Housing Market Trends
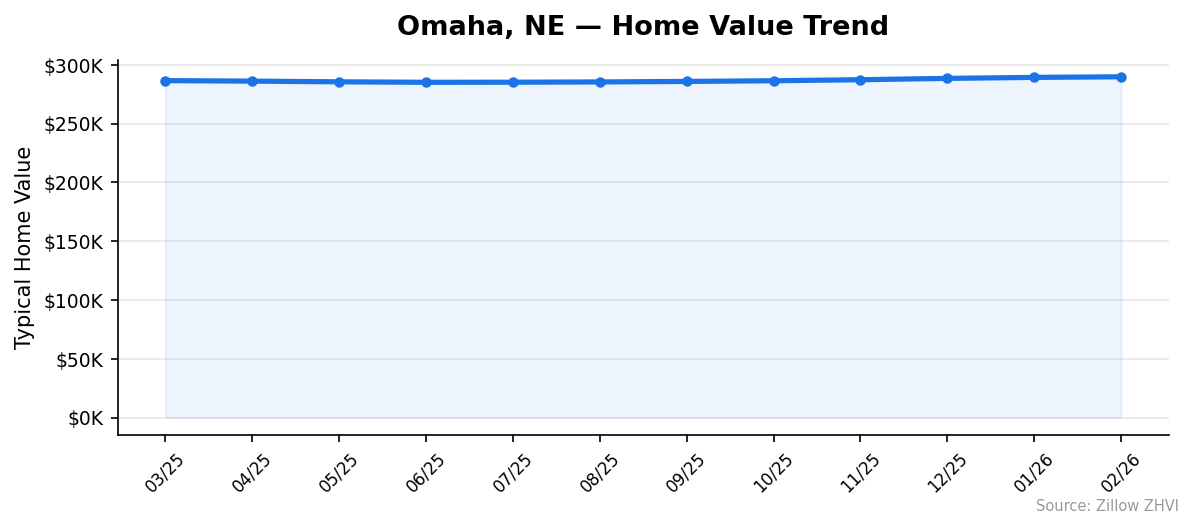
Prices have moved up every month for the past eight months. Here’s the 12-month picture:
| Month | Median value | MoM change |
|---|---|---|
| Mar 2025 | $286,521 | — |
| Apr 2025 | $286,114 | -0.1% |
| May 2025 | $285,511 | -0.2% |
| Jun 2025 | $285,116 | -0.1% |
| Jul 2025 | $285,176 | +0.0% |
| Aug 2025 | $285,416 | +0.1% |
| Sep 2025 | $285,856 | +0.2% |
| Oct 2025 | $286,422 | +0.2% |
| Nov 2025 | $287,297 | +0.3% |
| Dec 2025 | $288,444 | +0.4% |
| Jan 2026 | $289,292 | +0.3% |
| Feb 2026 | $289,795 | +0.2% |
The first half of 2025 saw prices drift down. June marked the bottom at $285,116. Since then, every month has posted a gain, and the size of those gains grew — peaking at +0.4% in December before easing slightly.
That’s $4,679 in appreciation over eight months from the June low. The pattern is consistent enough that it doesn’t look like noise. Buyers came back to the Omaha market in late summer 2025 and the demand has held.
The price spread is also widening. The cheapest ZIP value rose from $129,019 in June to $132,812 in February — about 3% growth on the low end. The priciest ZIP rose from $496,580 to $504,398 — about 1.6% on the high end. So the bottom is appreciating faster than the top, which historically signals a healthy market rather than a speculative one.
Is Omaha a Good Place to Buy in 2026?
The data points to a balanced market with slight buyer advantage at the high end and slight seller advantage at the low end.
For buyers in the affordable ZIPs (under $200K), supply is tight enough that prices are rising faster than the citywide average. If you’re shopping in 68111, 68107, or 68108, expect competition and limited inventory. The window to buy below $150K may be closing — the cheapest ZIP gained about 3% this year alone.
For buyers in the western suburbs ($400K+), the picture is different. Rent-to-price ratios are low, monthly carrying costs are high, and population growth in the metro is flat. There’s no rush. If you’re not committed to staying five-plus years, renting in 68022 or 68130 likely beats buying.
The middle of the market — ZIPs in the $250K-$320K range — is where most transactions happen. Modest 1.1% YoY appreciation here means you’re not catching a wave, but you’re also not losing money. It’s a market for people who need to live somewhere, not investors looking for outsized returns.
Mortgage rates remain the biggest variable outside the data. At current levels, monthly payments dominate the buy-vs-rent calculation more than the home price itself.
Omaha Housing Market Outlook for 2026-2027
The 3-month trend shows monthly gains averaging about 0.3%. Annualized, that’s roughly 3.6% — well above the trailing 12-month figure of 1.1%.
If the current pace continues through spring 2026, the typical home value would push past $292K by mid-year. The momentum is clearly upward, but it’s also slowing — February’s 0.2% gain was smaller than December’s 0.4%.
Two scenarios worth considering. First: the recent acceleration holds, and Omaha closes 2026 with 3-4% YoY appreciation. That would put the median around $300K. Second: the deceleration continues and prices flatten by summer, leaving full-year growth closer to 1.5-2%.
The flat population and below-trend nearby growth (Bellevue at -0.6%) argue against a sustained acceleration. Lincoln’s faster growth could pull demand south. Watch the monthly data: if MoM gains drop below 0.1%, the recent uptrend has likely run its course.
Similar Markets in NE
If you’re comparing Omaha to other Nebraska cities, the data tells different stories:
- Lincoln — The capital is the only Nebraska city with meaningful population growth (+3%). Worth comparing if you’re flexible on location.
- Bellevue — An Omaha suburb with similar demographics. Useful as a price comp for the southern metro.
- Stanton — A small-town comparison if you want to see how rural Nebraska prices stack up against Omaha.
Frequently Asked Questions
What is the average home price in Omaha?
The average home price in Omaha, NE is $289,795 as of February 2026. That figure represents the typical value across 31 ZIP codes in the city, with prices ranging from $132,812 in 68111 to $504,398 in 68022.
Are home prices going up or down in Omaha?
Prices are up 1.1% over the past year. The recent trend has been stronger — values have risen every month since June 2025, adding about $4,679 to the typical home over eight months.
Is it cheaper to rent or buy in Omaha?
Renting is cheaper in most Omaha ZIPs. Median rents run $999 to $1,788, while a mortgage on a $289,795 home with 20% down typically costs $2,000-$2,200 monthly with taxes and insurance. The exception is north Omaha, where buying in ZIP 68111 ($132,812) often beats the local rent.
What is the most affordable neighborhood in Omaha?
ZIP 68111 in north Omaha is the cheapest, with a typical home value of $132,812 — about 54% below the city median. The next most affordable are 68110 ($144,972) and 68108 ($166,511).
Methodology
Home values are based on the Zillow Home Value Index (ZHVI), a smoothed measure of typical home values in the 35th to 65th percentile range. Rent estimates use the Zillow Observed Rent Index (ZORI). Population figures come from the U.S. Census Bureau Population Estimates Program (2020-2024 vintage). All datasets are publicly available. Housing data updated 2026-02-28.