Miami Beach Home Prices: $2,022K, Up 0.2% — 4 ZIPs (2026)
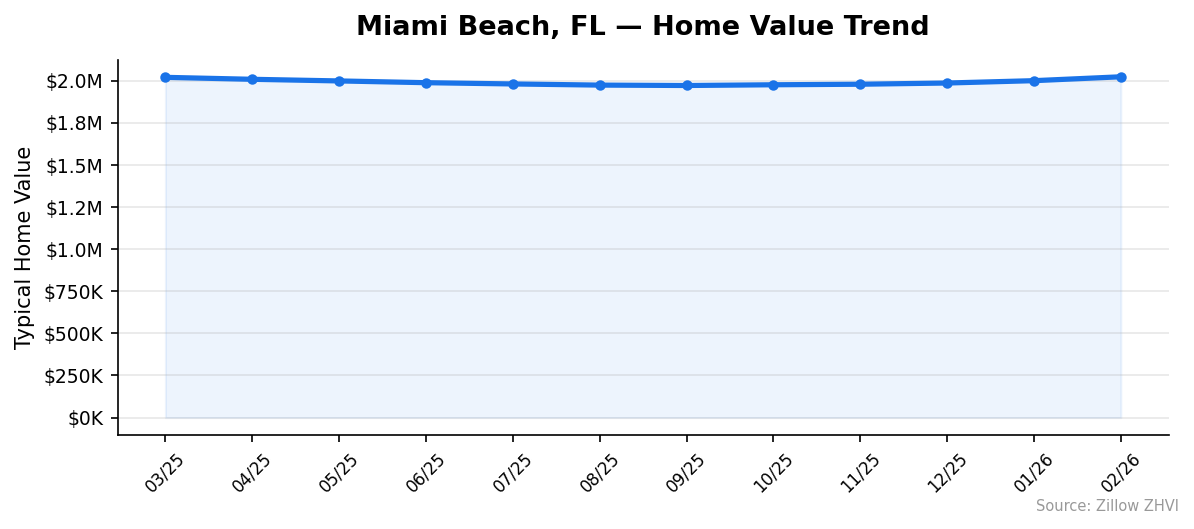
$2,022,147. That is the typical Miami Beach home value as of February 2026, up just 0.2% from a year ago. Prices slid through most of 2025 before clawing back in the past five months.
Quick answer: The average home price in Miami Beach, FL is $2,022,147 as of February 2026, up 0.2% year over year according to Zillow.
Current Home Prices in Miami Beach
The Miami Beach housing market sits at a near standstill. Year over year, the typical home gained $4,000 in value — not enough to cover one month of property tax on a high-end unit.
| Metric | Value |
|---|---|
| Median home value | $2,022,147 |
| Year-over-year change | +0.2% |
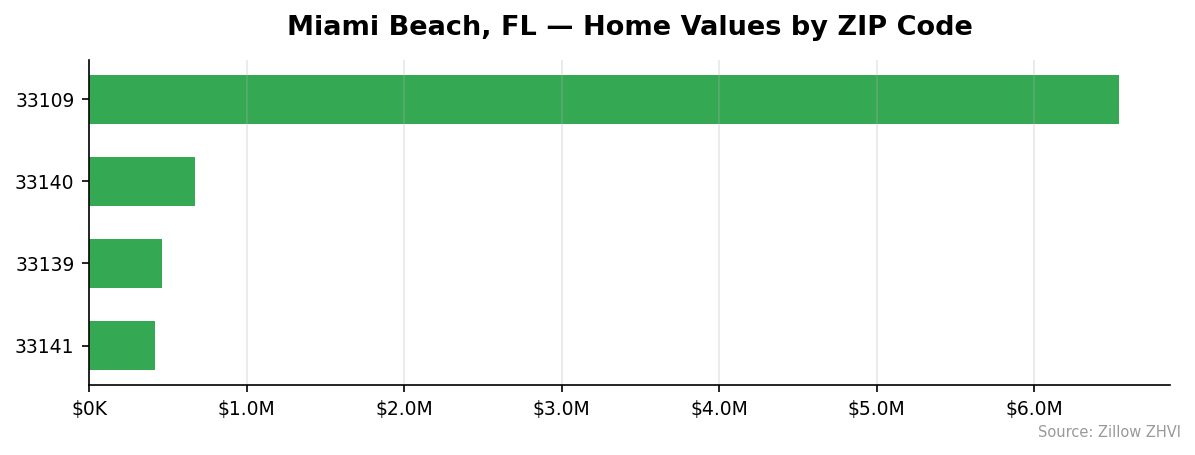
| Cheapest ZIP (typical home) | $415,958 |
| Priciest ZIP (typical home) | $6,536,567 |
| ZIP codes tracked | 4 |
| Data through | February 2026 |
The spread between the cheapest and priciest ZIPs is roughly 16x. That is one of the widest gaps you will see in any U.S. city of comparable size. A buyer with $450,000 and a buyer with $6 million are shopping in the same municipality.
The citywide median masks two different markets. North Beach condos and oceanfront estates are priced as if they belong in different countries. When you read “$2 million Miami Beach median,” remember that number is being pulled up by a single ultra-luxury enclave on Fisher Island.
Mid-range buyers — the people looking at the $400K to $700K range — make up the bulk of actual transactions. The luxury tail moves the average but does not move many units.
Miami Beach Home Prices by Neighborhood
| ZIP | Typical Home Value | Monthly Rent (ZORI) |
|---|---|---|
| 33109 | $6,536,567 | $28,500 |
| 33140 | $671,545 | $3,684 |
| 33139 | $464,519 | $2,843 |
| 33141 | $415,958 | $2,306 |
Most Expensive
- 33109 — At $6,536,567, Fisher Island sits more than 3x above the citywide median. Rent runs $28,500 a month.
- 33140 — Mid-Beach at $671,545. Rent of $3,684 makes it the city’s middle-tier neighborhood by both metrics.
- 33139 — South Beach at $464,519. The price reflects a heavy condo mix rather than single-family homes.
Most Affordable
- 33141 — North Beach is the cheapest at $415,958. Rent of $2,306 is also the lowest in the city.
- 33139 — South Beach is the second-cheapest. The $464,519 typical value puts it within reach of dual-income households earning around $200K.
Rent vs Buy in Miami Beach
Renting beats buying in every Miami Beach ZIP at current rates. The math is not close.
Take 33141, the cheapest ZIP. A $415,958 home with 20% down leaves a $332,766 loan. At a 7% 30-year fixed rate, principal and interest run about $2,214 a month. Add property tax (roughly $580/mo at Florida’s effective rate), insurance ($300+/mo given Florida’s hurricane premiums), and HOA fees on a typical condo ($400-600/mo), and the total monthly cost lands near $3,500.
Rent in 33141? $2,306. You save more than $1,000 a month renting, before counting the $83,000 down payment you keep liquid.
The gap widens as you move up. In 33140, a $671,545 home runs roughly $5,200/mo to own all-in. Rent there is $3,684. That is $1,500/mo of savings.
Fisher Island (33109) is its own universe. A $6.5M home costs around $42,000/mo to own. Rent is $28,500.
Buying in Miami Beach right now requires either a long holding horizon, a tax strategy that benefits from the deductions, or a belief that prices will rebound sharply. The straight cash-flow comparison favors renters.
Population Growth and Migration
Miami Beach is barely growing. The city added 776 residents between 2020 and 2024, a 0.9% gain over four years.
| Year | Population |
|---|---|
| 2020 | 82,475 |
| 2021 | 80,893 |
| 2022 | 81,240 |
| 2023 | 82,248 |
| 2024 | 83,251 |
The pandemic year saw a noticeable drop — population fell to 80,893 in 2021 — and the recovery has been slow and steady. The city is back above its 2020 level but only just.
Compare that to other Florida cities and Miami Beach looks stagnant.
| City | 2024 Population | 4-Year Growth |
|---|---|---|
| Port St. Lucie | 258,575 | +25.0% |
| Cape Coral | 233,025 | +19.2% |
| Miami | 487,014 | +10.0% |
| Orlando | 334,854 | +8.8% |
| Tampa | 414,547 | +6.7% |
| Miami Beach | 83,251 | +0.9% |
Florida’s growth story is happening on the mainland. Miami Beach’s island geography caps housing supply, and most new residents are choosing more affordable inland metros. Slow population growth tempers housing demand — there is no flood of new buyers competing for the same condos.
Miami Beach Housing Market Trends
Twelve months of data show a U-shaped pattern. Prices fell from March 2025 through September, bottomed out near $1.97M, and have recovered since.
| Month | Avg Home Value |
|---|---|
| Feb 2026 | $2,022,147 |
| Jan 2026 | $1,999,120 |
| Dec 2025 | $1,985,163 |
| Nov 2025 | $1,978,006 |
| Oct 2025 | $1,974,806 |
| Sep 2025 | $1,970,482 |
| Aug 2025 | $1,972,853 |
| Jul 2025 | $1,979,652 |
| Jun 2025 | $1,987,143 |
| May 2025 | $1,997,541 |
| Apr 2025 | $2,007,261 |
| Mar 2025 | $2,018,867 |
The Sep 2025 low of $1,970,482 marked a $48,000 drop from the March peak. Since then, values have rebounded $52,000 to retake the $2M line.
The recent five-month rise has been steady — between $7K and $23K added each month. February 2026 alone saw the biggest single-month jump of $23,027. Whether that pace holds matters for anyone weighing a 2026 purchase.
Is Miami Beach a Good Place to Buy in 2026?
The data points to a slight buyer’s market that is shifting. Year-over-year price growth of 0.2% means sellers have lost negotiating power — homes are not appreciating fast enough to bail out aggressive list prices.
But the recent five-month uptrend complicates things. If you waited for September’s bottom, you missed it. Prices are now $52,000 above that low.
Renting still wins on monthly cash flow in every ZIP. Buyers should run the numbers carefully and account for Florida’s elevated insurance costs and property taxes.
The case for buying: long holding period, expected hurricane premium stability, and confidence the recent rebound continues. The case against: the rent-versus-buy gap remains wide, and population growth is slow enough that demand is not pushing prices.
If you need to live in Miami Beach for fewer than seven years, the rent math is hard to beat at current mortgage rates.
Miami Beach Housing Market Outlook for 2026-2027
The 3-month trend suggests continued price recovery. Values rose by an average of $14,800 per month from December through February.
If the current pace continues into spring, the typical home value would cross $2.06M by mid-2026. That would put YoY growth closer to 2-3% rather than the 0.2% reading today.
Two things could break that trend. A hurricane season disruption to insurance markets could shock prices downward — Florida coastal premiums have been the wild card for two years running. A material drop in mortgage rates would push prices the other way.
The 12-month trend shows Miami Beach prices are sensitive to short-term shifts. The $48K drop from March to September 2025 happened with no major catalyst. Expect more of the same — modest moves in either direction rather than runaway gains or sharp crashes.
Similar Markets in FL
- Miami — The mainland neighbor. Different price point, different inventory mix, but the closest comparable market for buyers priced out of the Beach.
- Fort Lauderdale — Coastal alternative 30 miles north with broader inventory at lower prices.
- Hialeah — Inland Miami-Dade option with a much lower entry point for buyers willing to skip the beach.
- Pembroke Pines — Suburban Broward County, popular with families priced out of coastal markets.
- Tampa — Across the state, a different metro entirely, but a frequent destination for Miami-area buyers seeking lower costs.
Frequently Asked Questions
What is the average home price in Miami Beach?
The average home value in Miami Beach is $2,022,147 as of February 2026. That figure is a citywide blend of four ZIP codes ranging from $415,958 to $6,536,567.
Are home prices going up or down in Miami Beach?
Prices are up 0.2% year over year — essentially flat. Values declined from March through September 2025, hit a low of $1,970,482, then recovered $52,000 over the last five months.
Is it cheaper to rent or buy in Miami Beach?
Renting is cheaper in every ZIP. In the most affordable ZIP (33141), rent runs $2,306 a month while owning a typical $415,958 home costs roughly $3,500 a month all-in with 20% down at a 7% rate.
What is the most affordable neighborhood in Miami Beach?
ZIP 33141 in North Beach is the cheapest at a $415,958 typical home value. That is roughly one-fifth of the citywide median and the only ZIP with rents below $2,500.
Methodology
Home values are based on the Zillow Home Value Index (ZHVI), a smoothed measure of typical home values in the 35th to 65th percentile range. Rent estimates use the Zillow Observed Rent Index (ZORI). Population figures come from the U.S. Census Bureau Population Estimates Program (2020-2024 vintage). All datasets are publicly available. Housing data updated 2026-02-28.