Chula Vista Home Prices: $898K, Down 1.9% — 5 ZIPs Analyzed (2026)
$898,338. That’s what a typical home costs in Chula Vista right now — and it’s less than it was a year ago. Prices have slipped 1.9% year over year, marking a clear shift after years of relentless appreciation in San Diego County’s second-largest city.
Quick answer: The average home price in Chula Vista, CA is $898,338 as of February 2026, down 1.9% year over year according to Zillow.
Current Home Prices in Chula Vista
The median home value in Chula Vista sits at $898,338 as of February 2026. That’s a decline from $915,472 just eleven months ago.
| Metric | Value |
|---|---|
| Median Home Value | $898,338 |
| Year-over-Year Change | -1.9% |
| Lowest ZIP Median | $762,614 |
| Highest ZIP Median | $1,158,994 |
| Number of ZIP Codes | 5 |
| Data as of | February 2026 |
The price range within the city is wide. A gap of nearly $400,000 separates the cheapest and most expensive neighborhoods. That spread tells you Chula Vista is not one market — it’s several, stacked on top of each other.
The -1.9% annual drop may not sound dramatic, but context matters. This is a city in the San Diego metro, a region where prices rarely retreat. The last time the broader metro saw sustained declines was during the pandemic correction of 2022-2023. The current softening suggests buyers have hit a ceiling.
Still, $898K is not cheap by any national standard. Chula Vista remains firmly in the high end of U.S. housing markets, even after this pullback.
Chula Vista Home Prices by Neighborhood
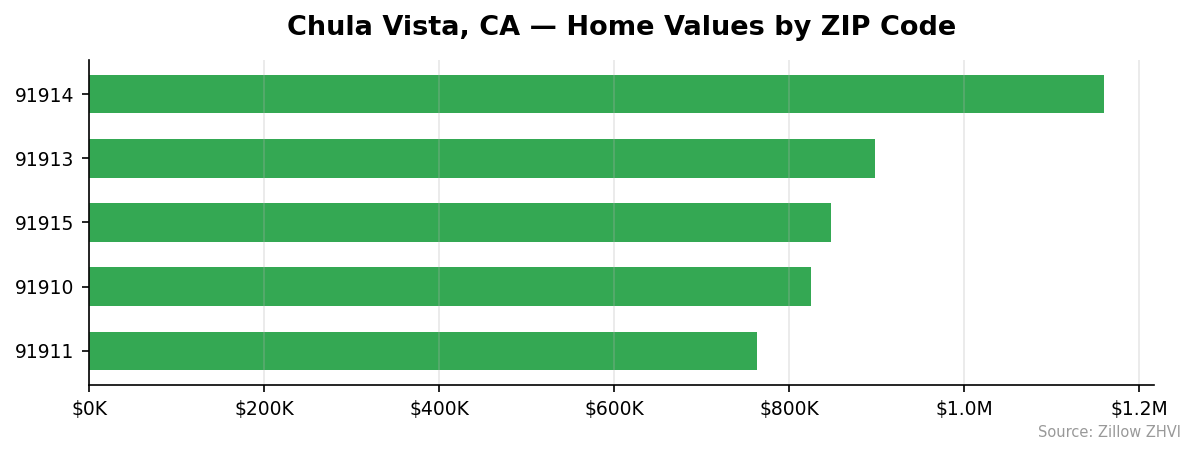
Prices vary sharply across Chula Vista’s five ZIP codes. The table below shows median home values and average monthly rents for each area.
| ZIP Code | Median Home Value | Avg Monthly Rent |
|---|---|---|
| 91914 | $1,158,994 | $4,435 |
| 91913 | $897,452 | $3,112 |
| 91915 | $847,811 | $3,088 |
| 91910 | $824,818 | $2,510 |
| 91911 | $762,614 | $2,742 |
Most Expensive
91914 dominates at $1,158,994 — nearly 29% above the city median. Rents here hit $4,435 per month, the highest in the city by a wide margin. This eastern ZIP includes the Eastlake and Rolling Hills Ranch communities.
91913 comes in at $897,452, almost perfectly matching the citywide median. Rents run $3,112. It sits right in the middle of the price spectrum.
91915 rounds out the top three at $847,811 with rents of $3,088. Prices here are about 6% below the city average.
Most Affordable
91911 is the entry point into Chula Vista homeownership at $762,614 — roughly $136,000 below the city median. Rents here are $2,742, making it more affordable on both the buy and rent sides.
91910 follows at $824,818 with the lowest rents in the city at $2,510. If you want the cheapest monthly housing cost in Chula Vista, this is the ZIP to watch.
91915 also qualifies as a relative value at $847,811, falling below the city average while offering newer housing stock in the Otay Ranch area.
Rent vs Buy in Chula Vista
Renting is significantly cheaper than buying in Chula Vista right now. Here’s the math.
The citywide average rent across all five ZIP codes is approximately $3,177 per month. A mortgage on the median home — assuming 20% down on $898,338, a 30-year fixed rate near 7%, plus property taxes and insurance — would cost roughly $5,200 to $5,500 per month.
| ZIP Code | Monthly Rent | Est. Monthly Mortgage* |
|---|---|---|
| 91911 | $2,742 | ~$4,350 |
| 91910 | $2,510 | ~$4,700 |
| 91913 | $3,112 | ~$5,120 |
| 91915 | $3,088 | ~$4,830 |
| 91914 | $4,435 | ~$6,610 |
*Estimated mortgage payment assumes 20% down, 7% interest rate, 30-year fixed. Does not include HOA fees.
The gap between renting and buying is at least $1,500 per month in most neighborhoods. In 91910, the difference is even starker — rents of $2,510 versus an estimated mortgage of $4,700.
That doesn’t mean buying is a bad move. Mortgage payments build equity. But purely on a monthly cash flow basis, renters have the advantage in Chula Vista right now, especially with prices softening.
Population Growth and Migration
Chula Vista’s population reached 278,546 in 2024, a 1.0% increase from 275,808 in 2020. Growth has been modest but consistent, with an uptick in 2023 and 2024 after a brief dip in 2021-2022.
| Year | Population |
|---|---|
| 2020 | 275,808 |
| 2021 | 275,745 |
| 2022 | 275,516 |
| 2023 | 276,181 |
| 2024 | 278,546 |
The city lost residents in 2021 and 2022 — likely a pandemic-era shift as some households moved to cheaper inland areas. But that trend reversed. The 2023-2024 rebound added over 3,000 residents, the largest two-year gain in the dataset.
How does Chula Vista compare to other California cities?
| City | 2024 Population | 4-Year Growth |
|---|---|---|
| Bakersfield | 417,468 | 3.0% |
| Sacramento | 535,798 | 1.9% |
| San Diego | 1,404,452 | 1.4% |
| Fresno | 550,105 | 1.4% |
| Chula Vista | 278,546 | 1.0% |
| Oakland | 443,554 | 0.6% |
Chula Vista’s 1.0% growth rate trails neighboring San Diego’s 1.4%, but it’s ahead of Oakland. For housing demand, steady population growth puts a floor under prices. More people means more competition for the same housing stock.
Chula Vista Housing Market Trends
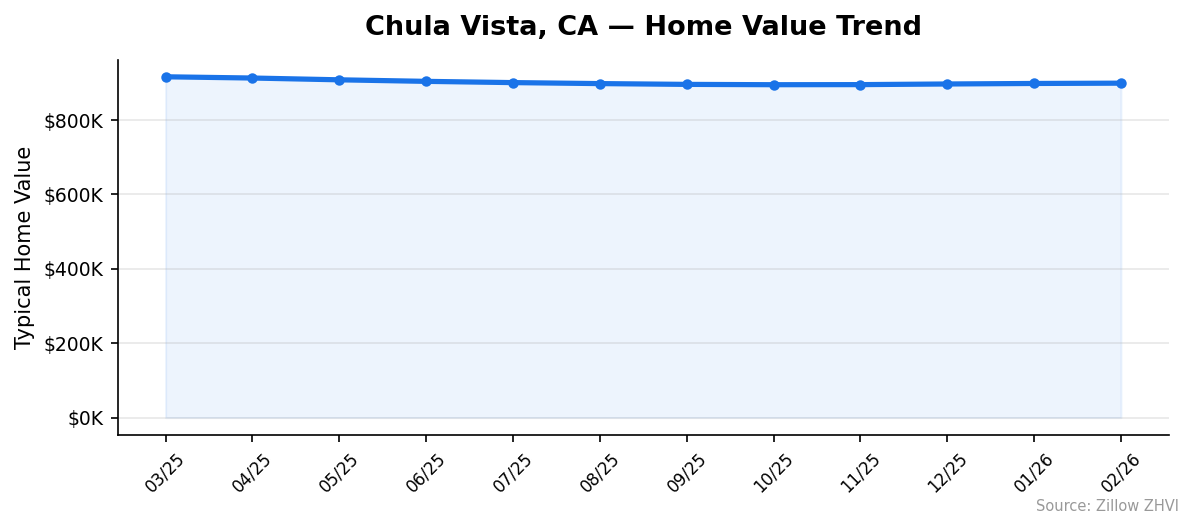
The 12-month trend shows a clear pattern: prices peaked in spring 2025 and have declined steadily since.
| Month | Median Value | Change from Peak |
|---|---|---|
| Mar 2025 | $915,472 | — |
| Apr 2025 | $912,137 | -$3,335 |
| May 2025 | $907,340 | -$8,132 |
| Jun 2025 | $903,205 | -$12,267 |
| Jul 2025 | $899,849 | -$15,623 |
| Aug 2025 | $897,186 | -$18,286 |
| Sep 2025 | $895,080 | -$20,392 |
| Oct 2025 | $894,195 | -$21,277 |
| Nov 2025 | $894,435 | -$21,037 |
| Dec 2025 | $896,145 | -$19,327 |
| Jan 2026 | $897,523 | -$17,949 |
| Feb 2026 | $898,338 | -$17,134 |
The data tells two stories. From March through October 2025, prices dropped $21,277 — a steady slide of about $3,000 per month. Then something shifted. Starting in November, prices began ticking back up. The last four months show a recovery of roughly $4,100.
That reversal is small but notable. Chula Vista may have found its floor near $894,000. The question is whether the recent uptick has momentum or is just seasonal noise.
Is Chula Vista a Good Place to Buy in 2026?
The data points to a market in transition. Prices are off their 2025 peak by $17,134, giving buyers slightly more room than they had a year ago. But “slightly more room” in Chula Vista still means close to $900K for a median home.
Buyers have two things working in their favor. First, the year-over-year decline of 1.9% means sellers can no longer name any price and expect offers. The bargaining power has shifted, even if modestly. Second, the price spread across neighborhoods gives options — from $763K in 91911 to $1.16M in 91914.
The challenge is affordability. With estimated mortgage payments well above $5,000 per month on the median home, you need a household income north of $150K to comfortably buy. The rent-to-own gap also suggests the market hasn’t corrected enough to make buying the obvious financial choice.
If you’re planning to stay five-plus years and can absorb the monthly cost, the recent softening creates a better entry point than any time in the past three years.
Chula Vista Housing Market Outlook for 2026-2027
The last four months of data show prices recovering from their October 2025 low. From $894,195 to $898,338, the market has clawed back about $4,100.
If the current pace continues — roughly $1,000 per month in gains — Chula Vista could retest $905,000 by mid-2026. But don’t expect a return to the March 2025 peak anytime soon. The 12-month downtrend erased $17,000 in value, and recoveries from that kind of slide tend to be gradual.
The three-month trend suggests stabilization rather than a sharp rebound. Monthly gains have been modest and consistent: $1,710 from November to December, $1,378 from December to January, and $815 from January to February. That deceleration is worth watching. The recovery may be flattening.
Expect Chula Vista to trade sideways in the $895,000 to $910,000 range through 2026, barring a major shift in mortgage rates or the broader San Diego economy.
Similar Markets in CA
If you’re exploring options beyond Chula Vista, these California cities offer different price points.
- San Diego — The larger neighbor to the north; useful for comparing metro-wide trends against Chula Vista’s local data.
- Riverside — Inland Empire pricing is substantially lower than San Diego County, making it a common alternative for buyers priced out of Chula Vista.
- Bakersfield — Central Valley affordability with the fastest population growth on this list at 3.0%.
- Long Beach — Another Southern California coastal market worth comparing for buyers who want proximity to the beach without LA prices.
- Fresno — A growing Central Valley city with significantly lower home prices than any coastal California market.
Frequently Asked Questions
What is the average home price in Chula Vista?
The average home price in Chula Vista is $898,338 as of February 2026. Prices range from $762,614 in ZIP code 91911 to $1,158,994 in ZIP code 91914. The citywide median has declined 1.9% compared to the same time last year.
Are home prices going up or down in Chula Vista?
Home prices in Chula Vista are down 1.9% year over year. Prices peaked at $915,472 in March 2025 and fell to a low of $894,195 in October 2025. The last four months show a modest recovery, with the median climbing back to $898,338 by February 2026.
Is it cheaper to rent or buy in Chula Vista?
Renting is cheaper. The average monthly rent across Chula Vista is approximately $3,177, while estimated mortgage payments on the median home run $5,200 to $5,500 per month (assuming 20% down and a 7% rate). That gap of roughly $2,000 per month favors renters on a pure cash flow basis.
What is the most affordable neighborhood in Chula Vista?
ZIP code 91911 is the most affordable area in Chula Vista with a median home value of $762,614 — about $136,000 below the city average. Monthly rents here average $2,742. The next most affordable is 91910 at $824,818, which has the city’s lowest rents at $2,510 per month.
Is Chula Vista growing or shrinking?
Chula Vista is growing. The city’s population increased from 275,808 in 2020 to 278,546 in 2024, a gain of 1.0%. After a slight dip in 2021-2022, the city added over 3,000 residents in 2023-2024, signaling renewed demand for housing.
Methodology
Home values are based on the Zillow Home Value Index (ZHVI), a smoothed measure of typical home values in the 35th to 65th percentile range. Rent estimates use the Zillow Observed Rent Index (ZORI). Population figures come from the U.S. Census Bureau Population Estimates Program (2020-2024 vintage). All datasets are publicly available. Housing data updated 2026-02-28.