Toledo Home Prices: $131K, Up 4% — 15 ZIPs Analyzed (2026)
$130,630. That’s what a typical Toledo home costs as of February 2026 — up 4.0% from a year earlier. Prices have climbed every month for the last seven months, even as the city itself keeps losing residents.
Quick answer: The average home price in Toledo, OH is $130,630 as of February 2026, up 4.0% year over year.
Current Home Prices in Toledo
Toledo remains one of the cheapest large cities in Ohio. The typical home costs less than half the U.S. national median, and the spread between ZIP codes is wide.
| Metric | Value |
|---|---|
| Median home value | $130,630 |
| Year-over-year change | +4.0% |
| Cheapest ZIP | 43608 ($48,146) |
| Most expensive ZIP | 43617 ($318,808) |
| Number of ZIPs analyzed | 15 |
| Data through | February 2026 |
The 4% annual gain isn’t huge, but it’s steady. A year ago, the median sat at about $125,600. Twelve months later, it’s roughly $5,000 higher.
What stands out is the price spread. The most expensive ZIP costs 6.6 times the cheapest one. That’s an unusually wide gap for a city Toledo’s size, and it tells you the local market behaves more like several smaller markets stitched together. Suburban-feeling areas command real money. Older urban neighborhoods are still trading under $70K.
For buyers, this matters. A $130,000 “average” doesn’t describe what you’ll actually pay. The number you see depends almost entirely on which ZIP you’re shopping.
Toledo Home Prices by Neighborhood
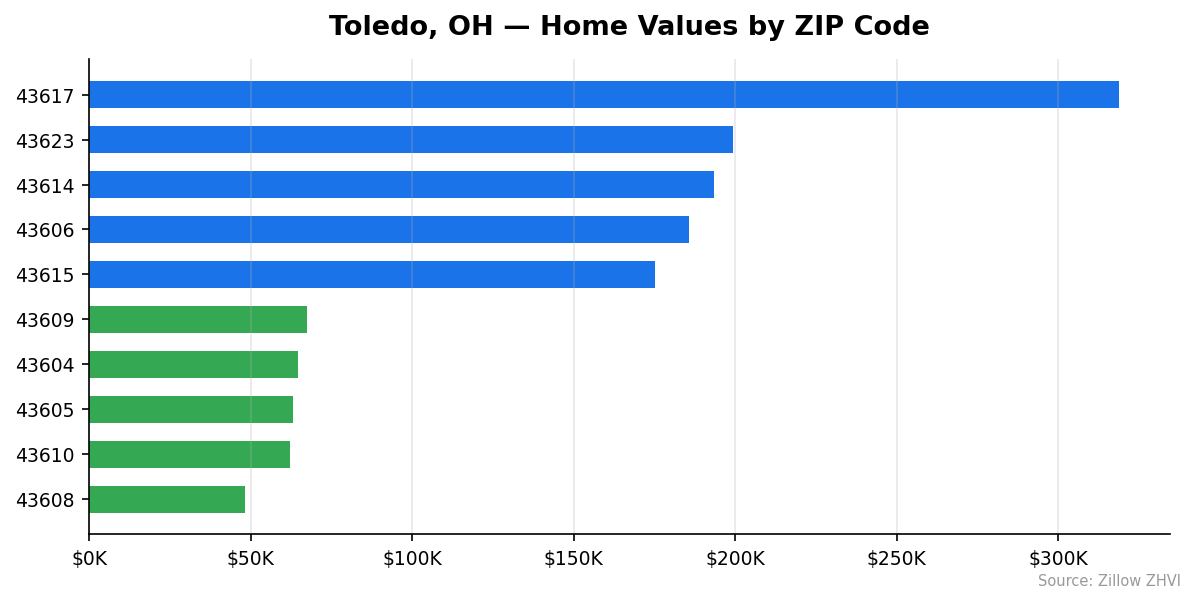
Here are all 15 Toledo ZIPs, ranked by typical home value.
| ZIP | Typical Home Value | Avg Rent (ZORI) |
|---|---|---|
| 43617 | $318,808 | — |
| 43623 | $199,236 | — |
| 43614 | $193,615 | $1,045 |
| 43606 | $185,763 | $1,012 |
| 43615 | $175,248 | $1,251 |
| 43613 | $152,946 | $1,054 |
| 43611 | $147,589 | — |
| 43612 | $113,546 | $1,046 |
| 43620 | $91,816 | — |
| 43607 | $74,971 | $1,218 |
| 43609 | $67,541 | $1,021 |
| 43604 | $64,671 | — |
| 43605 | $63,233 | $988 |
| 43610 | $62,322 | — |
| 43608 | $48,146 | $1,020 |
Most Expensive
43617 at $318,808 sits well above every other Toledo ZIP — more than 2.4x the citywide median. It’s the only neighborhood where typical homes cross the $300K mark.
43623 comes in at $199,236, the second priciest. Homes here trade at roughly 1.5x the city average.
43614 rounds out the top three at $193,615, with rents that look modest at $1,045 — buyers in this ZIP appear to pay a clear premium over renters.
Most Affordable
43608 is the cheapest at $48,146, less than 40% of the city median. Yet rent there averages $1,020/month, which is striking against a sub-$50K purchase price.
43610 comes next at $62,322. Like 43608, it’s an older urban ZIP where home values have stayed compressed.
43605 lands at $63,233 with the lowest rent in the city ($988). This is the only Toledo ZIP where average rent dips below four figures.
Rent vs Buy in Toledo
Average rent across the nine Toledo ZIPs with rent data is roughly $1,074/month.
A median-priced home at $130,630 with 20% down ($26,126) leaves a $104,504 mortgage. At today’s rates, that’s approximately:
| Cost component | Monthly |
|---|---|
| Principal & interest (~7%) | ~$695 |
| Property tax (~1.5%/yr) | ~$163 |
| Homeowners insurance | ~$80 |
| Total monthly | ~$938 |
Owning beats renting on monthly cash flow by about $135. That’s before factoring in maintenance, which typically runs 1% of home value annually — another ~$110/month for the median Toledo home.
The math gets more interesting at the extremes. In ZIP 43608, the typical home costs $48,146. With 20% down, the monthly payment drops to roughly $400 all-in — less than half the area’s $1,020 average rent. Few American markets offer that kind of buy-vs-rent gap.
The flip side: the rental premium in 43607 ($1,218 rent) makes that ZIP one of the better value buys for would-be landlords, since homes there average just $74,971.
Population Growth and Migration
Toledo is losing people. The city had 270,285 residents in 2020. By 2024, that number was 265,638 — a 1.7% drop over four years.
| Year | Population |
|---|---|
| 2020 | 270,285 |
| 2021 | 268,860 |
| 2022 | 266,637 |
| 2023 | 265,798 |
| 2024 | 265,638 |
The decline has slowed. Toledo lost about 2,200 people in 2022, but only 160 in 2024. Still, no year shows growth.
Compared with other Ohio cities, Toledo trails most of the state:
| City | 2024 Population | 4-yr Change |
|---|---|---|
| Columbus | 933,263 | +3.0% |
| Cincinnati | 314,915 | +1.7% |
| Lorain | 65,751 | +0.8% |
| Hamilton | 63,953 | +0.8% |
| Akron | 189,664 | -0.3% |
| Toledo | 265,638 | -1.7% |
Population loss usually drags housing demand. Toledo’s 4% price gain despite a shrinking resident base suggests the supply side matters more here — fewer homes coming on market, plus low absolute prices that attract investors and first-time buyers from outside the city.
Toledo Housing Market Trends
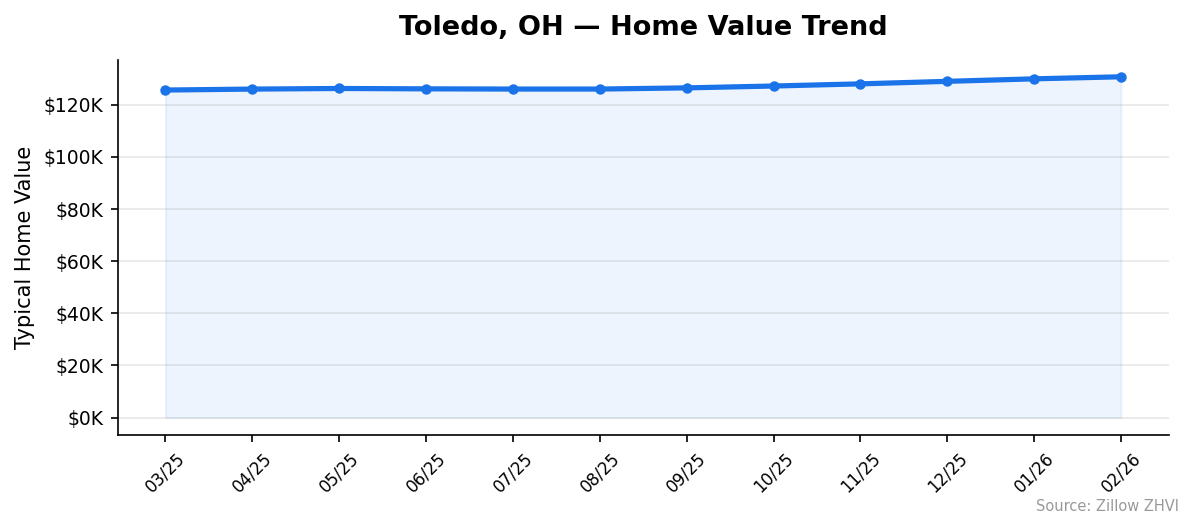
Prices have moved in one direction for most of the past year.
| Month | Median Value |
|---|---|
| 2026-02 | $130,630 |
| 2026-01 | $129,846 |
| 2025-12 | $128,884 |
| 2025-11 | $127,918 |
| 2025-10 | $127,094 |
| 2025-09 | $126,382 |
| 2025-08 | $125,930 |
| 2025-07 | $125,926 |
| 2025-06 | $126,010 |
| 2025-05 | $126,148 |
| 2025-04 | $125,917 |
| 2025-03 | $125,551 |
The trend is clear. From March 2025 through July 2025, prices flatlined around $125,500-$126,150 — even dipping slightly in some months. Then something shifted. From August onward, every single month posted a gain.
The recent acceleration is real. December to February alone added $1,746 to the median — roughly $580/month. If that pace held all year, prices would gain about 5.4% annually, faster than the trailing 4.0% reading.
Is Toledo a Good Place to Buy in 2026?
The data points to a buyer’s market that’s tilting. Prices are below national averages, mortgage payments come in under average rents, and the cheapest ZIPs trade for less than a new car.
But momentum favors sellers. After a flat spring and early summer 2025, every month since August has set a new high. The 4% annual gain understates what’s happened recently — the actual three-month run rate is closer to 5-6%.
Population is the headwind. Fewer residents typically means weaker demand long-term. That’s already showing up as a divided market: suburban-style ZIPs like 43617 and 43623 hold value, while some urban ZIPs trade for less than half their early-2010s peaks.
For owner-occupants planning to stay 5+ years, the rent-vs-buy math works at almost every price point. For investors, the rent-to-price ratios in cheaper ZIPs are unusually strong by national standards.
Toledo Housing Market Outlook for 2026-2027
The 3-month trend (December to February) added $1,746 to the median — about $580/month. The 6-month trend (August to February) added $4,700, or roughly $780/month. Both are steeper than the trailing 12-month pace.
If the current pace continues, Toledo prices would push toward the mid-$130,000s by mid-2026 and approach $140,000 by year-end. That would mark a meaningful acceleration over the 4% annual reading.
A few things could slow it. Population loss has been steady, and any uptick in mortgage rates would compress affordability. The wide ZIP spread also means citywide medians can shift fast based on which areas trade.
Watch the cheapest ZIPs. They’ve held below $70,000 for years. If they start moving, that’s a sign the entry-level market is heating, and the citywide trend will follow.
Similar Markets in OH
Toledo buyers exploring other Ohio cities have plenty of options at different price points:
- Cleveland — another older industrial city with a comparable price profile.
- Dayton — similar size to Toledo with a Midwestern affordability story.
- Cincinnati — a step up in price, with stronger population growth (+1.7%).
- Columbus — Ohio’s growth leader (+3.0% over four years), but at significantly higher prices.
- Akron — close in size to Toledo, with slower price gains.
Frequently Asked Questions
What is the average home price in Toledo?
The median home value in Toledo, OH is $130,630 as of February 2026. That’s based on the Zillow Home Value Index covering 15 ZIP codes within the city, ranging from $48,146 in the cheapest neighborhood to $318,808 in the priciest.
Are home prices going up or down in Toledo?
Prices are up 4.0% year over year. The trend has accelerated since last summer — every month from August 2025 through February 2026 posted a gain, and the most recent three months added about $580/month to the median.
Is it cheaper to rent or buy in Toledo?
Buying is cheaper on monthly cash flow. A median Toledo home with 20% down runs roughly $940/month including taxes and insurance, versus an average rent of about $1,074. The advantage widens dramatically in cheaper ZIPs like 43608, where ownership runs less than half the local rent.
What is the most affordable neighborhood in Toledo?
ZIP 43608 is the cheapest at $48,146 — about 37% of the citywide median. ZIPs 43610 ($62,322) and 43605 ($63,233) round out the three most affordable areas. All three are older urban neighborhoods where home values have stayed compressed for years.
Methodology
Home values are based on the Zillow Home Value Index (ZHVI), a smoothed measure of typical home values in the 35th to 65th percentile range. Rent estimates use the Zillow Observed Rent Index (ZORI). Population figures come from the U.S. Census Bureau Population Estimates Program (2020-2024 vintage). All datasets are publicly available. Housing data updated 2026-02-28.