Springfield OH Home Prices: $184K, Up 4% — 6 ZIPs Analyzed (2026)
$183,900. That’s what a typical home costs in Springfield, OH as of February 2026. Prices are up 4.0% from a year ago — modest by recent standards, but the trend has been steady for nearly a year.
Quick answer: The average home price in Springfield, OH is $183,900 as of February 2026, up 4.0% year over year according to Zillow.
Current Home Prices in Springfield
The city’s typical home value sits at $183,900. That number reflects the middle of the market — homes in the 35th to 65th percentile of value.
| Metric | Value |
|---|---|
| Median home value | $183,900 |
| Year-over-year change | +4.0% |
| Cheapest ZIP | $113,484 |
| Most expensive ZIP | $299,503 |
| ZIPs tracked | 6 |
| Data through | February 2026 |
The gap between the cheapest and most expensive ZIPs is large. The top ZIP costs 2.6 times what the bottom ZIP costs. That spread matters if you’re shopping — the difference between 45502 and 45506 is roughly $186,000.
Springfield remains well below the national median home price. Compared to Ohio’s larger metros, it sits at a discount. The 4% annual gain trails inflation in some years but beats it in others. Right now, you’re looking at slow, consistent appreciation rather than the boom-bust pattern seen in faster-growing markets.
The price floor — $113,484 in ZIP 45506 — is unusually low for any U.S. city today. For buyers priced out elsewhere, that number alone is worth a second look.
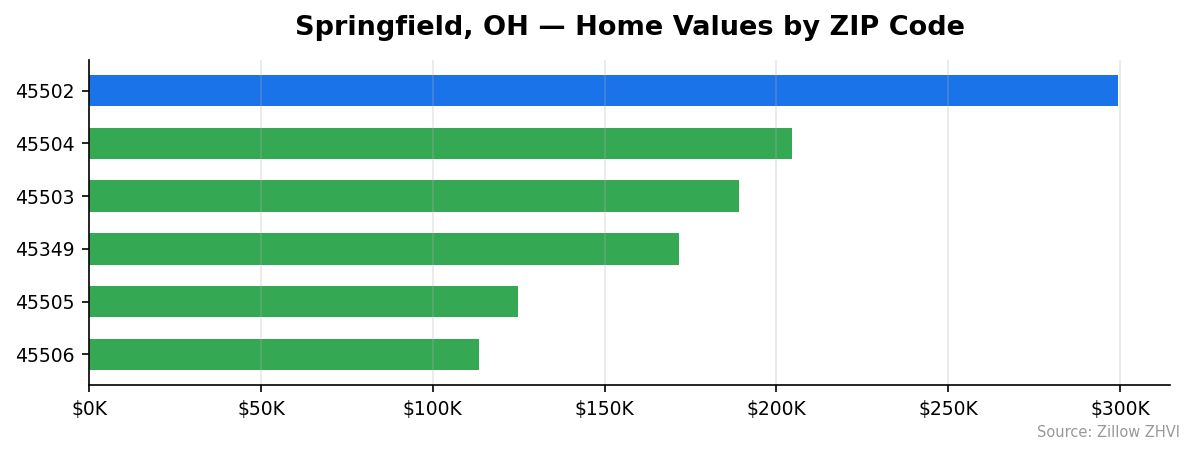
Springfield Home Prices by Neighborhood
Six ZIP codes cover the Springfield market. Prices range from $113,484 to $299,503.
| ZIP | Median Home Value | vs City Avg |
|---|---|---|
| 45502 | $299,503 | +63% |
| 45504 | $204,633 | +11% |
| 45503 | $189,137 | +3% |
| 45349 | $171,720 | -7% |
| 45505 | $124,921 | -32% |
| 45506 | $113,484 | -38% |
Most Expensive
- 45502 — $299,503. The priciest ZIP in Springfield, 63% above the city median.
- 45504 — $204,633. A step down, but still 11% above the city average.
- 45503 — $189,137. Sits near the city median, with rent averaging $873 per month.
Most Affordable
- 45506 — $113,484. The cheapest ZIP, 38% below the city median.
- 45505 — $124,921. Second-cheapest, with rent averaging $1,071 per month — higher than 45503 despite lower home prices.
- 45349 — $171,720. Slightly below the city average.
Rent vs Buy in Springfield
Rent data is available for two ZIPs. ZIP 45503 averages $872.50 per month. ZIP 45505 averages $1,071.25.
The math is worth running. At a $124,921 home price in 45505 with 20% down ($24,984) and a 30-year mortgage at 7% on the remaining $99,937, the principal and interest payment lands near $665 per month. Add taxes and insurance (roughly $200-$300 in Ohio) and you’re looking at $865 to $965 — close to or below the $1,071 rent average.
For 45503, the same calculation on a $189,137 home with 20% down comes to roughly $1,007 in principal and interest. Add taxes and insurance and ownership runs $1,200 to $1,300 — above the $872 rent.
Lower-priced ZIPs flip the math toward buying. Higher-priced ZIPs favor renting at current rates. Your down payment, credit profile, and loan terms will shift these numbers, but the pattern holds: Springfield is one of those markets where ownership math actually works in the cheaper neighborhoods.
Population Growth and Migration
Springfield is losing residents. The city had 58,590 people in 2020. By 2024, it had 58,138. That’s a 0.8% decline.
| Year | Population |
|---|---|
| 2020 | 58,590 |
| 2021 | 58,333 |
| 2022 | 57,955 |
| 2023 | 58,041 |
| 2024 | 58,138 |
The trend bottomed out in 2022 and has ticked up slightly the past two years. The city hasn’t recovered its 2020 count.
| City | 2024 Population | 4-Year Growth |
|---|---|---|
| Columbus | 933,263 | +3.0% |
| Cincinnati | 314,915 | +1.7% |
| Lorain | 65,751 | +0.8% |
| Hamilton | 63,953 | +0.8% |
| Springfield | 58,138 | -0.8% |
| Akron | 189,664 | -0.3% |
Springfield is shrinking faster than Akron and lagging the state’s growing cities by a wide margin. Yet home prices still climbed 4% over the past year. Limited new construction and steady demand from buyers seeking affordability appear to be pushing values up despite the population drop.
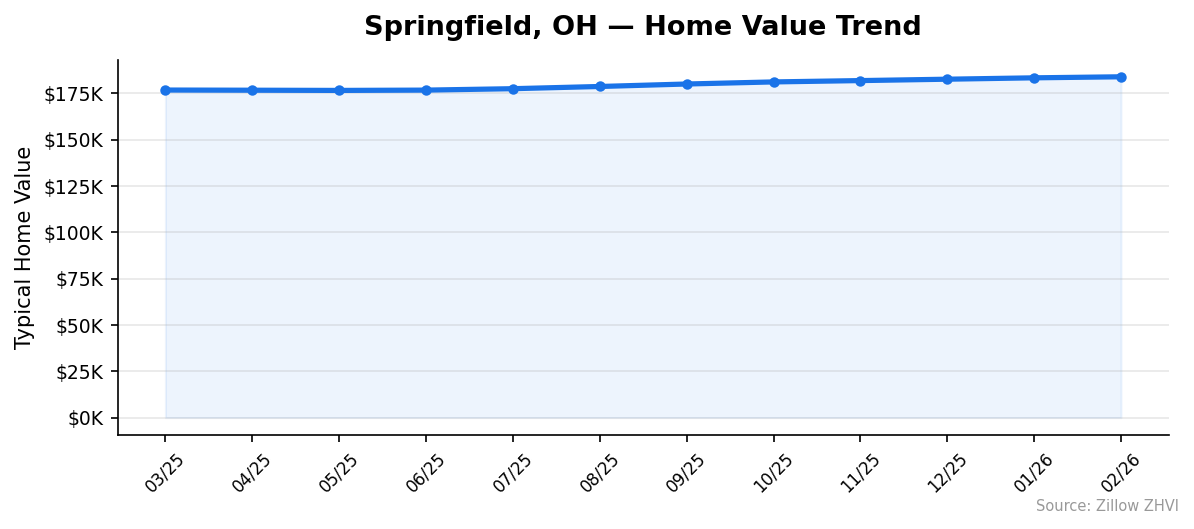
Springfield Housing Market Trends
Prices have risen every month for nearly a year. The trend is steady.
| Month | Median Value | Cheapest ZIP | Most Expensive ZIP |
|---|---|---|---|
| Feb 2026 | $183,900 | $113,484 | $299,503 |
| Jan 2026 | $183,341 | $113,372 | $298,648 |
| Dec 2025 | $182,599 | $113,117 | $297,723 |
| Nov 2025 | $181,849 | $113,084 | $296,643 |
| Oct 2025 | $181,132 | $112,673 | $295,423 |
| Sep 2025 | $180,006 | $111,614 | $293,965 |
| Aug 2025 | $178,668 | $110,402 | $292,267 |
| Jul 2025 | $177,478 | $109,607 | $290,857 |
| Jun 2025 | $176,710 | $109,669 | $289,685 |
| May 2025 | $176,545 | $110,572 | $289,438 |
| Apr 2025 | $176,653 | $111,777 | $289,616 |
| Mar 2025 | $176,749 | $112,736 | $289,769 |
From March 2025 to February 2026, the median rose from $176,749 to $183,900 — a gain of $7,151 or 4.0%. The biggest monthly jump came between June and July ($768). The smallest came between April and May, when values dipped $108.
Momentum picked up in the second half of 2025. Six of the last seven months posted gains over $500.
Is Springfield a Good Place to Buy in 2026?
The data points to a buyer-friendly market with a few caveats. Springfield is one of the most affordable cities in Ohio. The bottom-tier ZIPs offer homes below $125,000 — territory most U.S. metros lost a decade ago.
But the city is shrinking. Population is down 0.8% since 2020. That limits long-term price appreciation potential. If you’re buying as an investment, the math is tighter than in growing metros like Columbus.
For owner-occupiers, the picture looks different. Monthly costs in the cheaper ZIPs can match or beat rent. You build equity instead of paying a landlord. The 4% annual price gain isn’t going to make you rich, but it covers inflation and then some.
The 12-month price trend is steady upward — no signs of a crash. Inventory and time-on-market data aren’t covered here, but the price pattern suggests demand still exceeds supply at current levels.
Springfield Housing Market Outlook for 2026-2027
The 12-month trend shows steady appreciation with no signs of slowdown. Values rose every month from April 2025 through February 2026.
If the current pace continues, the median could approach $190,000 by mid-2026. The 3-month trend (December through February) averaged roughly $650 per month in gains — about a 4.3% annualized rate.
The cheapest ZIP, 45506, has gained slowly. It rose from $112,736 in March 2025 to $113,484 in February 2026 — less than 1% appreciation. The most expensive ZIP, 45502, rose from $289,769 to $299,503 over the same window — about 3.4%.
Population decline could eventually cap upside. But with no monthly data showing a reversal yet, the near-term direction looks positive. Watch the spring 2026 selling season for signs of acceleration or stalling.
Similar Markets in OH
- Hamilton — A larger Ohio city with similar affordability and slow population growth.
- Middletown — Another mid-size Ohio market worth comparing on price per ZIP.
- Dayton — Springfield’s closest larger neighbor, with a broader ZIP selection.
- Mansfield — Comparable size, similar affordability profile.
- Toledo — Larger market with more ZIP variety and similar Midwest pricing patterns.
Frequently Asked Questions
What is the average home price in Springfield?
The average home price in Springfield, OH is $183,900 as of February 2026. That figure represents the typical value across six ZIP codes and reflects the middle of the local market.
Are home prices going up or down in Springfield?
Prices are up 4.0% year over year. The trend has been consistent — values have risen every month from April 2025 through February 2026, gaining roughly $7,150 over that span.
Is it cheaper to rent or buy in Springfield?
It depends on the ZIP. In cheaper areas like 45505, monthly ownership costs with 20% down can run below the $1,071 average rent. In pricier ZIPs like 45503, rent at $873 generally beats buying once taxes and insurance are added.
What is the most affordable neighborhood in Springfield?
ZIP 45506 is the cheapest at $113,484 — 38% below the city median. ZIP 45505 follows at $124,921, also well under the city average. Both sit far below what most U.S. markets offer at the entry level.
Methodology
Home values are based on the Zillow Home Value Index (ZHVI), a smoothed measure of typical home values in the 35th to 65th percentile range. Rent estimates use the Zillow Observed Rent Index (ZORI). Population figures come from the U.S. Census Bureau Population Estimates Program (2020-2024 vintage). All datasets are publicly available. Housing data updated 2026-02-28.