Columbus GA Home Prices: $160K, Up 0.7% — 6 ZIPs Analyzed (2026)
$159,581. That’s what a typical home costs in Columbus, GA right now. Prices edged up 0.7% over the past year — barely keeping pace with inflation. For a metro area straddling the Georgia-Alabama border with over 200,000 residents, Columbus remains one of the more affordable markets in the Southeast.
Quick answer: The average home price in Columbus, GA is $159,581 as of February 2026, up 0.7% year over year according to Zillow.
Current Home Prices in Columbus
Here’s a snapshot of the Columbus housing market as of February 2026:
| Metric | Value |
|---|---|
| Median Home Price | $159,581 |
| Year-over-Year Change | +0.7% |
| Lowest ZIP Median | $70,512 |
| Highest ZIP Median | $229,478 |
| ZIP Codes Tracked | 6 |
| Data Period | February 2026 |
A 0.7% annual gain means Columbus homeowners saw roughly $1,100 in appreciation over the past year. That’s not the kind of equity growth that gets investors excited, but it does signal stability. Prices haven’t swung wildly in either direction.
The spread between the cheapest and most expensive ZIP codes is $158,966. That’s a wide gap for a mid-size city — it tells you that where you buy in Columbus matters a lot more than when you buy.
At $160K, Columbus sits well below the national median, which hovers above $350,000. Your dollar stretches further here than in most Georgia metros.
Columbus Home Prices by Neighborhood
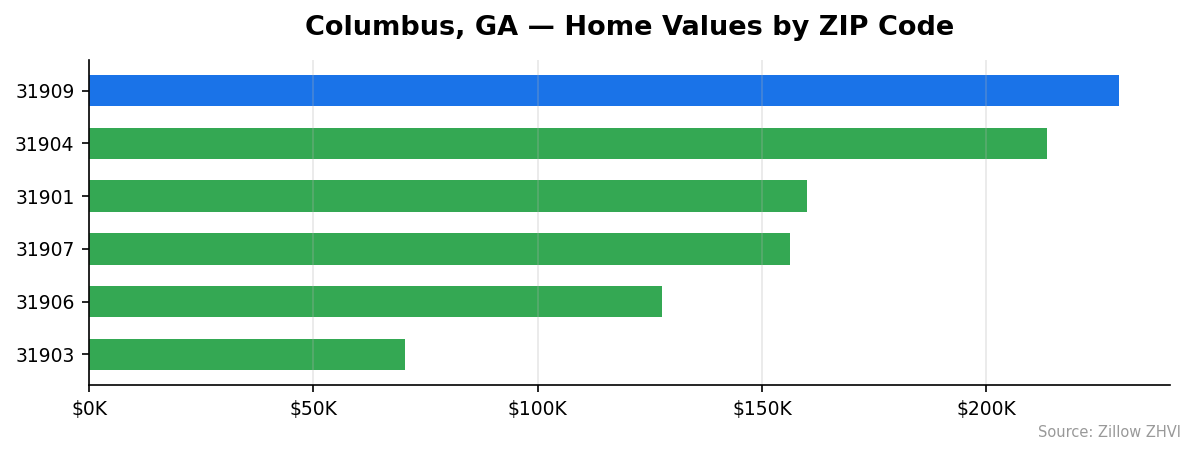
All six tracked ZIP codes in Columbus show significant price variation:
| ZIP Code | Median Home Value | Avg. Monthly Rent |
|---|---|---|
| 31909 | $229,478 | $1,500 |
| 31904 | $213,534 | $1,313 |
| 31901 | $160,021 | $1,097 |
| 31907 | $156,192 | $1,187 |
| 31906 | $127,747 | $892 |
| 31903 | $70,512 | $911 |
Most Expensive ZIPs
31909 leads Columbus at $229,478 — roughly 44% above the city median — with rents to match at $1,500/month. 31904 follows at $213,534 with $1,313 average rent, making it the second priciest area. 31901 sits right at the city average, $160,021, and serves as the dividing line between the upper and lower halves of the market.
Most Affordable ZIPs
31903 is the clear budget pick at $70,512 — less than a third of what you’d pay in 31909. Rent there runs $911/month. 31906 comes in at $127,747 with the lowest rents in the city at $892/month. 31907 rounds out the affordable side at $156,192, though its rent of $1,187 is higher than you’d expect given the home prices.
Rent vs Buy in Columbus
Renting and buying costs are closer than you might think in Columbus, but the math favors buyers in most ZIP codes.
| ZIP Code | Avg. Rent | Est. Mortgage | Difference |
|---|---|---|---|
| 31903 | $911 | ~$415 | Buying saves $496/mo |
| 31906 | $892 | ~$752 | Buying saves $140/mo |
| 31907 | $1,187 | ~$919 | Buying saves $268/mo |
| 31901 | $1,097 | ~$942 | Buying saves $155/mo |
| 31904 | $1,313 | ~$1,257 | Buying saves $56/mo |
| 31909 | $1,500 | ~$1,351 | Buying saves $149/mo |
Mortgage estimates assume 20% down, 6.5% rate, 30-year fixed. Does not include taxes, insurance, or maintenance.
Across all six ZIP codes, buying is cheaper on a pure monthly payment basis. The biggest gap is in 31903, where a mortgage payment runs roughly half the cost of rent. Even in the priciest ZIP, 31909, you’d save about $149/month owning versus renting.
The catch: homeownership costs extend beyond the mortgage. Property taxes, insurance, and maintenance typically add 1-2% of home value annually. Still, at Columbus price levels, the total cost of ownership remains competitive with renting for anyone planning to stay at least 3-5 years.
Population Growth and Migration
Columbus is losing residents. The metro population dropped from 207,015 in 2020 to 201,830 in 2024 — a decline of 2.5% over four years.
| Year | Population | Change |
|---|---|---|
| 2020 | 207,015 | — |
| 2021 | 205,094 | -1,921 |
| 2022 | 202,658 | -2,436 |
| 2023 | 201,959 | -699 |
| 2024 | 201,830 | -129 |
The bleeding has slowed. Columbus lost 2,436 people between 2021 and 2022 but only 129 between 2023 and 2024. That’s not growth, but the outflow is nearly flat.
Compare that with other Georgia metros:
| City | 2024 Population | 4-Year Growth |
|---|---|---|
| Atlanta | 520,070 | +4.0% |
| Warner Robins | 86,199 | +7.0% |
| South Fulton | 112,003 | +3.5% |
| Athens | 128,691 | +1.1% |
| Savannah | 148,808 | +0.9% |
| Columbus | 201,830 | -2.5% |
Columbus is the only city on this list losing people. Warner Robins, about 90 miles northeast, grew 7% in the same period. A shrinking population typically puts downward pressure on housing demand, which may explain why Columbus prices have barely moved.
Columbus Housing Market Trends
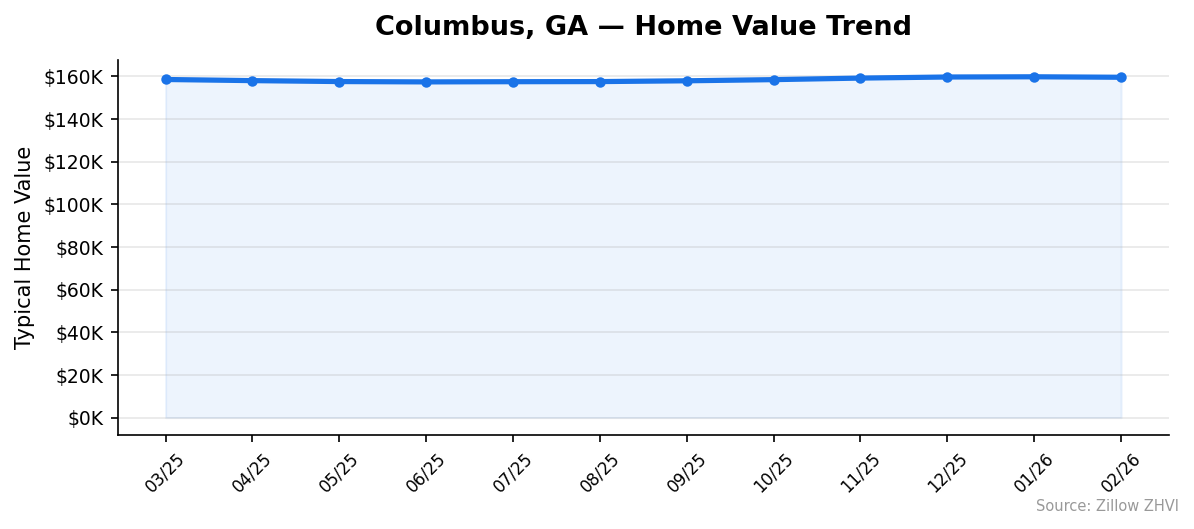
Here’s how the median home price has moved month-by-month over the past year:
| Month | Median Price | Low | High |
|---|---|---|---|
| Feb 2026 | $159,581 | $70,512 | $229,478 |
| Jan 2026 | $159,802 | $71,014 | $229,307 |
| Dec 2025 | $159,700 | $70,814 | $228,913 |
| Nov 2025 | $159,193 | $70,012 | $228,167 |
| Oct 2025 | $158,467 | $69,129 | $227,182 |
| Sep 2025 | $157,924 | $68,519 | $226,375 |
| Aug 2025 | $157,552 | $68,030 | $225,703 |
| Jul 2025 | $157,501 | $67,938 | $225,184 |
| Jun 2025 | $157,406 | $67,780 | $224,449 |
| May 2025 | $157,566 | $68,245 | $223,685 |
| Apr 2025 | $158,005 | $69,127 | $223,299 |
| Mar 2025 | $158,535 | $70,364 | $223,067 |
Prices dipped slightly from March through June 2025, hitting a low of $157,406 in June. From there, the trend reversed. Columbus has posted eight consecutive months of increases from June 2025 through February 2026.
The total gain from trough to peak: $2,175, or about 1.4%. Not dramatic, but consistently upward. The price floor (cheapest ZIP) has risen in lockstep — from $67,780 in June to $70,512 in February. The ceiling climbed from $224,449 to $229,478 in the same period, a gain of $5,029.
Is Columbus a Good Place to Buy in 2026?
The numbers tell a straightforward story. Columbus is cheap, stable, and slow-moving.
At $159,581, you’re buying well below the national median. Monthly costs undercut rents in every ZIP code. Price appreciation is modest but positive. The market isn’t overheated — there’s no bubble risk when prices are growing at 0.7% per year.
The downside: population decline. Fewer people means softer demand. You won’t see rapid equity gains here. Columbus is a buy-and-hold market, not a flip market.
If you’re stationed at Fort Moore (formerly Fort Benning), buying makes financial sense if you’ll be there 3+ years. The mortgage-versus-rent savings are real and immediate. If you’re an investor, the low entry price and steady rents in areas like 31906 ($892/month rent on a $128K home) offer reasonable cash-flow potential.
Columbus Housing Market Outlook for 2026-2027
The 12-month trend shows a slow, consistent climb. From June 2025’s low of $157,406 to February 2026’s $159,581, Columbus gained about $270 per month on average.
If the current pace continues, expect the median to reach the $161,000-$163,000 range by late 2026. That’s not headline-making growth, but it keeps pace with modest inflation.
The flattening population loss is worth watching. If Columbus stabilizes its resident count, even flat population growth could nudge housing demand slightly higher. The three-month trend from December through February shows prices holding steady around $159,600-$159,800 — the market may be finding a short-term ceiling before the spring buying season.
Similar Markets in GA
If you’re shopping in Georgia, these markets offer useful comparisons:
- Atlanta — The state’s biggest market with significantly higher prices, but stronger appreciation and population growth.
- Augusta — Another military-adjacent city on the Georgia border with a similar price profile.
- Warner Robins — Smaller than Columbus but growing 7% — worth a look if you want a rising market at a low price point.
- Savannah — Coastal Georgia with tourism-driven demand and slightly higher prices.
- Athens — College-town market with steady rental demand from UGA students.
Frequently Asked Questions
What is the average home price in Columbus?
The average home price in Columbus, GA is $159,581 as of February 2026. That figure represents the citywide median across six tracked ZIP codes. Prices range from $70,512 in the 31903 ZIP to $229,478 in 31909.
Are home prices going up or down in Columbus?
Prices are up 0.7% year over year. The market bottomed in June 2025 at $157,406 and has risen steadily since, posting eight consecutive months of gains. The pace is slow but the direction is consistently upward.
Is it cheaper to rent or buy in Columbus?
Buying is cheaper than renting in all six Columbus ZIP codes on a monthly payment basis. The biggest savings come in 31903, where a mortgage runs roughly $415/month versus $911 in rent. Even in the most expensive ZIP (31909), buying saves about $149/month. These figures assume 20% down and a 6.5% interest rate.
What is the most affordable neighborhood in Columbus?
ZIP code 31903 is the most affordable at $70,512 median home value — less than half the city average. Average rent in the area is $911/month. The next cheapest option is 31906 at $127,747 with the city’s lowest rents at $892/month.
Methodology
Home values are based on the Zillow Home Value Index (ZHVI), a smoothed measure of typical home values in the 35th to 65th percentile range. Rent estimates use the Zillow Observed Rent Index (ZORI). Population figures come from the U.S. Census Bureau Population Estimates Program (2020-2024 vintage). All datasets are publicly available. Housing data updated 2026-02-28.