Atlanta Home Prices: $451K, Down 1.6% — 25 ZIPs Analyzed (2026)
$450,651. That’s what a typical home in Atlanta costs right now — and it’s actually less than it was a year ago.
The city’s median home value slipped 1.6% over the past 12 months. In a metro that spent years watching prices climb, that’s a shift worth paying attention to. Here’s what the numbers look like across all 25 ZIP codes.
Quick answer: The average home price in Atlanta, GA is $450,651 as of February 2026, down 1.6% year over year according to Zillow.
Current Home Prices in Atlanta
| Metric | Value |
|---|---|
| Median Home Value | $450,651 |
| Year-over-Year Change | -1.6% |
| Lowest ZIP Value | $199,605 (30303) |
| Highest ZIP Value | $1,471,920 (30327) |
| Number of ZIPs Tracked | 25 |
| Data as of | February 2026 |
The gap between Atlanta’s cheapest and most expensive ZIP codes is massive — over $1.27 million. That range tells you Atlanta isn’t one housing market. It’s at least a dozen, stacked on top of each other.
The 1.6% annual decline is modest. It won’t make headlines. But for a city that saw rapid appreciation in 2021–2023, even a flat-to-negative year signals that the market has cooled. Buyers have more room to negotiate. Sellers can’t name their price the way they could two years ago.
At $450,651, Atlanta sits above the national median but well below comparable Sun Belt metros like Miami or Nashville. If you’re relocating from the Northeast or West Coast, these prices still look like a bargain.
Atlanta Home Prices by Neighborhood
| ZIP Code | Typical Home Value | Typical Rent |
|---|---|---|
| 30303 | $199,605 | $2,107 |
| 30314 | $217,873 | $1,725 |
| 30311 | $229,266 | $1,847 |
| 30354 | $230,450 | $1,696 |
| 30315 | $241,491 | $1,753 |
| 30310 | $254,110 | $1,837 |
| 30331 | $268,161 | $1,772 |
| 30336 | $280,808 | — |
| 30363 | $306,324 | $1,959 |
| 30313 | $323,597 | $1,806 |
| 30308 | $327,702 | $2,029 |
| 30340 | $377,546 | $1,382 |
| 30318 | $382,650 | $1,717 |
| 30309 | $393,887 | $2,214 |
| 30316 | $395,957 | $1,981 |
| 30326 | $411,320 | $2,126 |
| 30312 | $449,797 | $1,946 |
| 30324 | $485,831 | $1,634 |
| 30329 | $512,701 | $1,720 |
| 30317 | $554,011 | $2,033 |
| 30345 | $624,794 | $1,510 |
| 30305 | $681,370 | $2,171 |
| 30307 | $716,368 | $2,123 |
| 30306 | $928,737 | $2,130 |
| 30327 | $1,471,920 | $1,785 |
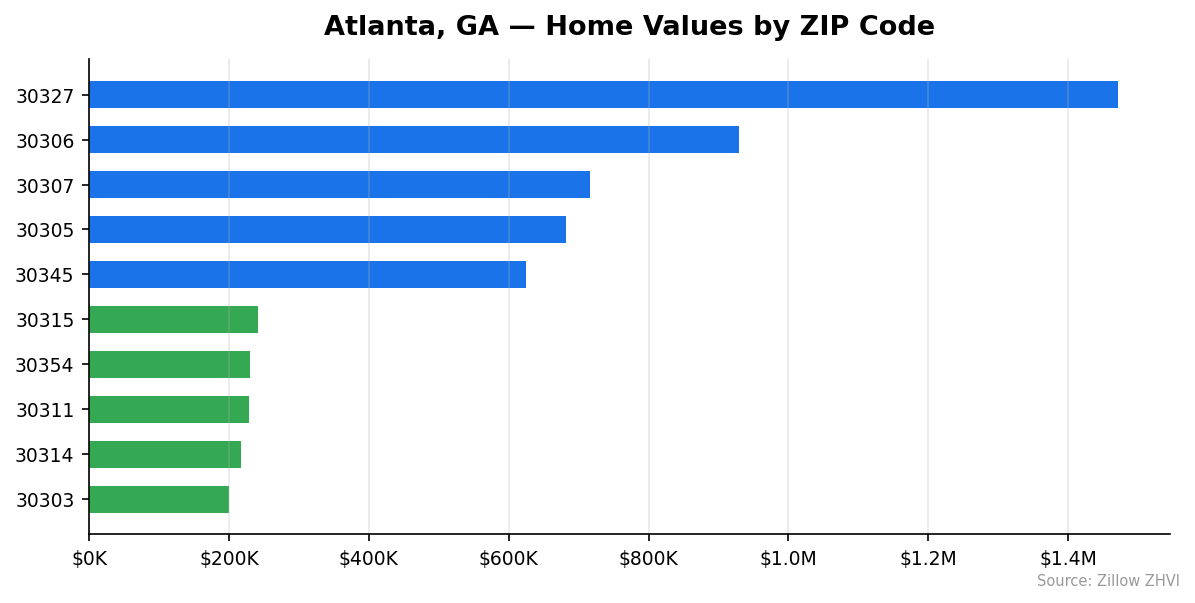
Most Expensive ZIPs
30327 tops the list at $1,471,920 — more than triple the citywide median. Rents here are a relatively modest $1,785, which tells you this is an owner-occupied, high-wealth area. 30306 comes in second at $928,737 with rents above $2,100, reflecting strong demand from both buyers and renters. 30307 rounds out the top three at $716,368. These three ZIPs alone account for Atlanta’s luxury tier, and they pull the city’s average up considerably.
Most Affordable ZIPs
30303 in downtown Atlanta is the cheapest at $199,605 — the only ZIP below $200K. The catch: rent here is $2,107, one of the highest in the city. That’s a classic urban inversion where buying is cheap but renting is not. 30314 at $217,873 and 30311 at $229,266 offer the next-lowest entry points, both with rents in the $1,700–$1,850 range.
Rent vs Buy in Atlanta
Renting is cheaper on a monthly basis — but the math depends heavily on which ZIP code you’re looking at.
| Comparison | Monthly Cost |
|---|---|
| Typical Rent (citywide range) | $1,382 – $2,214 |
| Estimated Mortgage Payment* | ~$2,398 |
Based on median home value of $450,651, 20% down, 30-year fixed at 7%.
At the median price, your monthly principal and interest payment would run about $2,398. Add property taxes and insurance, and you’re likely above $2,800. Most Atlanta rents fall between $1,700 and $2,100, saving you $700–$1,100 per month.
But the rent-vs-buy equation flips in certain areas. In 30340 (northeast Atlanta), rents are just $1,382 while homes run $377,546. That’s one of the better deals for renters. In 30303, homes cost $199,605 but rent is $2,107 — buying is dramatically cheaper if you can get a mortgage.
The city’s 1.6% price decline also factors in. If prices continue to slide, the financial case for waiting and renting gets stronger. If they stabilize, buyers lock in equity at a discount.
Population Growth and Migration
Atlanta added 20,072 residents between 2020 and 2024, a 4.0% growth rate. The city now has 520,070 people.
| Year | Population |
|---|---|
| 2020 | 499,998 |
| 2021 | 492,892 |
| 2022 | 500,249 |
| 2023 | 513,184 |
| 2024 | 520,070 |
The city actually lost residents in 2021 — dropping below 493,000 — before rebounding sharply. Since that low point, Atlanta has added roughly 27,000 people in three years.
How Atlanta Compares to Other Georgia Cities
| City | 2024 Population | 4-Year Growth |
|---|---|---|
| Atlanta | 520,070 | 4.0% |
| Macon-Bibb County | 157,056 | 0.0% |
| Savannah | 148,808 | 0.9% |
| Athens-Clarke County | 128,691 | 1.1% |
| South Fulton | 112,003 | 3.5% |
| Warner Robins | 86,199 | 7.0% |
Warner Robins is growing faster in percentage terms, but Atlanta is adding far more people in raw numbers. Macon is flat. Savannah and Athens are barely growing.
Steady population growth supports housing demand. More people need places to live, which puts a floor under prices even as the market softens. Atlanta’s post-2021 rebound suggests the city’s appeal hasn’t faded — the pandemic dip was temporary.
Atlanta Housing Market Trends
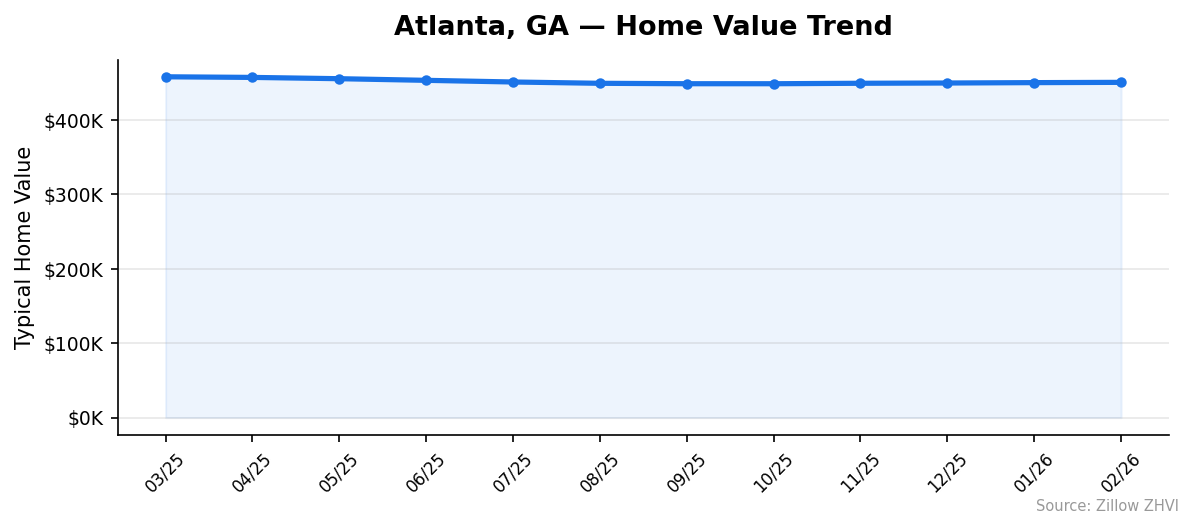
Here’s how the median home value moved over the past 12 months:
| Month | Median Value | Change from Prior Month |
|---|---|---|
| March 2025 | $458,129 | — |
| April 2025 | $457,297 | -$832 |
| May 2025 | $455,561 | -$1,736 |
| June 2025 | $453,364 | -$2,197 |
| July 2025 | $451,134 | -$2,230 |
| August 2025 | $449,373 | -$1,761 |
| September 2025 | $448,808 | -$565 |
| October 2025 | $448,794 | -$14 |
| November 2025 | $449,415 | +$621 |
| December 2025 | $449,761 | +$346 |
| January 2026 | $450,277 | +$516 |
| February 2026 | $450,651 | +$374 |
The pattern is clear. Prices fell steadily from March through October 2025, losing about $9,300 over seven months. Then they bottomed out and started climbing again. The last four months have been positive, though gains are small — a few hundred dollars each month.
This looks like a soft landing, not a crash. The decline was gradual and the recovery started before prices could drop much further.
Is Atlanta a Good Place to Buy in 2026?
The data points to a buyer-friendly market — not a buyer’s bonanza, but a better environment than 2023 or 2024.
Prices are down 1.6% year over year. That means sellers are giving ground. At the same time, the four-month uptrend since October suggests the bottom may already be in. If you’re waiting for a bigger drop, you might not get one.
The $199,605-to-$1.47M price range means there’s something for nearly every budget. Entry-level buyers can target ZIPs like 30303, 30314, or 30311. Move-up buyers have options in the $400K–$600K range across a dozen neighborhoods.
Population growth of 4.0% in four years supports long-term demand. Atlanta is still adding residents, and that trend shows no sign of reversing.
The main headwind is affordability. At 7% mortgage rates, even a $450K home stretches monthly budgets. If rates drop in late 2026, expect prices to respond with more upward pressure.
Atlanta Housing Market Outlook for 2026-2027
The three-month trend suggests Atlanta prices are stabilizing, not falling. Monthly gains of $346 to $621 since November 2025 indicate gentle upward momentum.
If the current pace continues — roughly $400–$500 per month in appreciation — you’d see the median reach somewhere around $453,000–$456,000 by mid-2026. That would still be below the March 2025 peak of $458,129.
The slower rate of monthly gains (from $621 in November to $374 in February) suggests the rebound is losing steam. Prices may flatten rather than accelerate. A return to the $458K level probably requires either lower mortgage rates or a surge in demand.
The population trend is a tailwind. Atlanta is growing, and growing cities tend to see price support even in softer markets.
Similar Markets in GA
If you’re considering Atlanta, these Georgia cities offer different price points and market conditions:
- Marietta — a close-in suburb in the Atlanta metro, often with lower prices than the city itself
- Decatur — another intown alternative with its own character and walkable downtown
- Lawrenceville — further out in Gwinnett County, typically more affordable
- Savannah — a different market entirely, with coastal pricing and slower population growth
- Athens — a college town with a strong rental market and lower home prices
Frequently Asked Questions
What is the average home price in Atlanta?
The average home price in Atlanta is $450,651 as of February 2026. That’s based on the Zillow Home Value Index, which tracks typical values in the 35th-to-65th percentile range. Prices vary enormously by ZIP code, from $199,605 in 30303 to $1,471,920 in 30327.
Are home prices going up or down in Atlanta?
Prices are down 1.6% compared to a year ago. However, the monthly trend has reversed — values have risen slightly each month since October 2025. The annual decline is shrinking, and the market appears to be stabilizing.
Is it cheaper to rent or buy in Atlanta?
Renting is cheaper for most buyers at current prices and rates. A mortgage on the median home runs about $2,398 per month (principal and interest only), while typical rents range from $1,382 to $2,214 depending on location. After adding taxes and insurance, buying costs $800–$1,200 more per month than renting in most neighborhoods.
What is the most affordable neighborhood in Atlanta?
ZIP code 30303 in downtown Atlanta has the lowest typical home value at $199,605. That’s less than half the citywide median. Other affordable options include 30314 ($217,873) and 30311 ($229,266), both on the west side of the city.
Methodology
Home values are based on the Zillow Home Value Index (ZHVI), a smoothed measure of typical home values in the 35th to 65th percentile range. Rent estimates use the Zillow Observed Rent Index (ZORI). Population figures come from the U.S. Census Bureau Population Estimates Program (2020-2024 vintage). All datasets are publicly available. Housing data updated 2026-02-28.