Savannah Home Prices: $336K, Down 3.9% — 7 ZIPs Analyzed (2026)
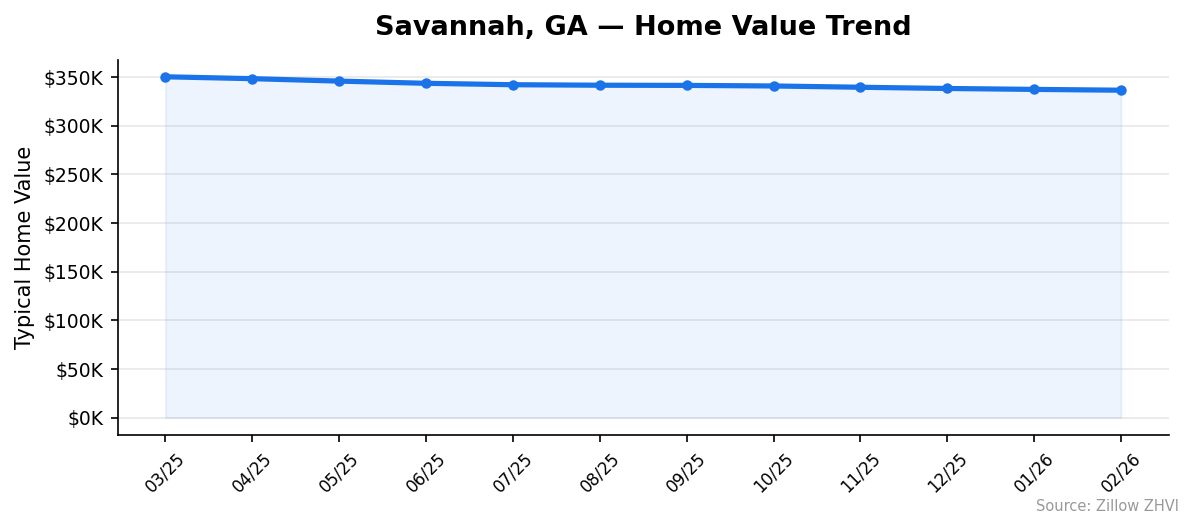
Prices dropped for the 12th straight month. The typical home in Savannah now costs $336,335, down 3.9% from a year ago. That’s a loss of roughly $13,800 in value over 12 months.
Quick answer: The average home price in Savannah, GA is $336,335 as of February 2026, down 3.9% year over year according to Zillow.
Current Home Prices in Savannah
| Metric | Value |
|---|---|
| Median Home Price | $336,335 |
| Year-over-Year Change | -3.9% |
| Lowest ZIP Value | $141,040 (31415) |
| Highest ZIP Value | $559,204 (31401) |
| ZIP Codes Tracked | 7 |
| Data As Of | February 2026 |
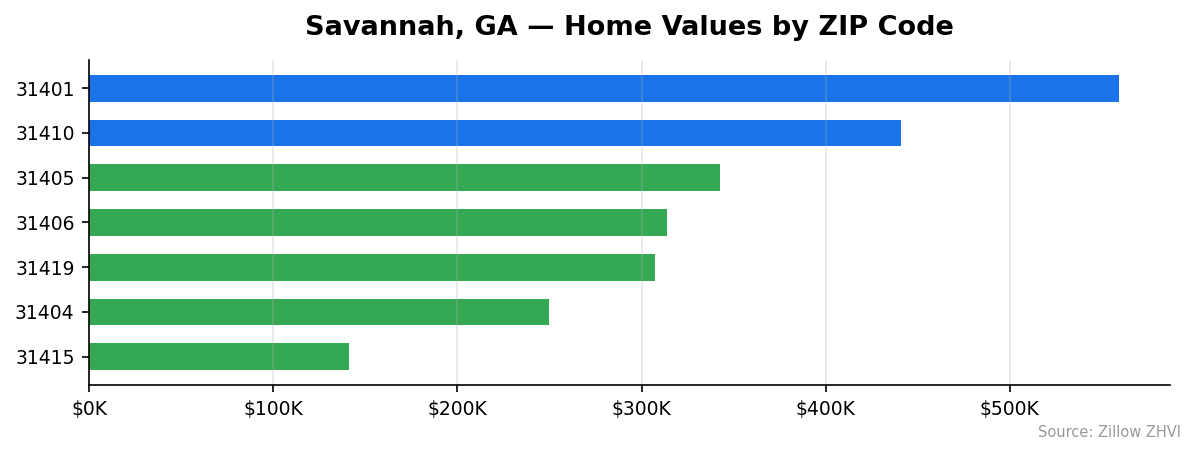
The gap between Savannah’s cheapest and most expensive neighborhoods is massive. A home in 31401 costs nearly four times what you’d pay in 31415. That $418,000 spread means Savannah is really two different markets depending on where you look.
The 3.9% annual decline puts Savannah among the cooling markets in Georgia. Prices peaked around March 2025 at $350,132 and have slid steadily since. February’s reading of $336,335 is the lowest in the 12-month window.
For buyers, this is a shift. A year ago, homes in Savannah cost about $350,000. Today, that same money gives you more square footage or a better neighborhood.
Savannah Home Prices by Neighborhood
| ZIP Code | Median Home Value | Median Rent | Rent-to-Price Ratio |
|---|---|---|---|
| 31401 | $559,204 | $2,115 | 0.38% |
| 31410 | $440,760 | $1,861 | 0.42% |
| 31405 | $342,470 | $1,676 | 0.49% |
| 31406 | $313,921 | $1,698 | 0.54% |
| 31419 | $307,146 | $1,548 | 0.50% |
| 31404 | $249,802 | $1,720 | 0.69% |
| 31415 | $141,040 | $1,696 | 1.20% |
Most Expensive ZIPs
31401 leads at $559,204 — this is Savannah’s historic district area, priced 66% above the city median with rents to match at $2,115 per month.
31410 comes in at $440,760, about 31% above the city average, with the second-highest rents at $1,861.
31405 sits right near the citywide median at $342,470, making it the entry point to Savannah’s upper-half neighborhoods.
Most Affordable ZIPs
31415 is the clear budget pick at $141,040 — less than half the city median. Rents here run $1,696, which actually exceeds some pricier ZIPs. That 1.20% rent-to-price ratio signals strong rental yield for investors.
31404 at $249,802 offers a middle ground. Rents of $1,720 are among the highest relative to home values, giving this ZIP the second-best rent-to-price ratio.
31419 rounds out the affordable tier at $307,146 with the lowest rents in the city at $1,548.
Rent vs Buy in Savannah
The rent-or-buy math in Savannah depends heavily on which ZIP code you’re looking at.
At the citywide median of $336,335, a conventional mortgage (20% down, 6.8% rate, 30-year fixed) puts your monthly payment at roughly $2,210 including principal, interest, taxes, and insurance. The average rent across all seven tracked ZIPs comes to about $1,759.
That’s a $450 monthly gap favoring renters.
But the picture flips in certain neighborhoods. In 31415, where homes cost $141,040, a mortgage payment runs about $925 per month. Rent there is $1,696. Buying saves you $771 every month. The same pattern holds in 31404, where a $249,802 home costs roughly $1,640 monthly to own against $1,720 in rent.
| ZIP | Monthly Mortgage (est.) | Monthly Rent | Difference |
|---|---|---|---|
| 31401 | $3,670 | $2,115 | +$1,555 (renting cheaper) |
| 31410 | $2,895 | $1,861 | +$1,034 (renting cheaper) |
| 31405 | $2,250 | $1,676 | +$574 (renting cheaper) |
| 31406 | $2,060 | $1,698 | +$362 (renting cheaper) |
| 31419 | $2,015 | $1,548 | +$467 (renting cheaper) |
| 31404 | $1,640 | $1,720 | -$80 (buying cheaper) |
| 31415 | $925 | $1,696 | -$771 (buying cheaper) |
In the two most affordable ZIPs, buying beats renting. Everywhere else, renting costs less on a monthly basis — though you’re not building equity.
Population Growth and Migration
Savannah’s population has barely budged. The city grew from 147,494 in 2020 to 148,808 in 2024 — a gain of just 1,314 residents over four years, or 0.9%.
| Year | Population | Change |
|---|---|---|
| 2020 | 147,494 | — |
| 2021 | 146,525 | -969 |
| 2022 | 148,281 | +1,756 |
| 2023 | 148,333 | +52 |
| 2024 | 148,808 | +475 |
The city actually lost residents in 2021 before bouncing back. Growth since 2022 has been minimal — a few hundred people per year.
Compared to other Georgia cities, Savannah is among the slowest growers.
| City | 2024 Population | 4-Year Growth |
|---|---|---|
| Warner Robins | 86,199 | +7.0% |
| Atlanta | 520,070 | +4.0% |
| South Fulton | 112,003 | +3.5% |
| Athens | 128,691 | +1.1% |
| Savannah | 148,808 | +0.9% |
| Macon-Bibb County | 157,056 | 0.0% |
Flat population growth means housing demand isn’t being fueled by new arrivals. That’s consistent with the falling prices — there isn’t enough population pressure to keep values climbing.
Savannah Housing Market Trends
Twelve months of decline. Here’s the full trajectory.
| Month | Median Value | Monthly Change |
|---|---|---|
| Mar 2025 | $350,132 | — |
| Apr 2025 | $348,200 | -$1,932 |
| May 2025 | $345,699 | -$2,501 |
| Jun 2025 | $343,442 | -$2,257 |
| Jul 2025 | $341,982 | -$1,460 |
| Aug 2025 | $341,471 | -$511 |
| Sep 2025 | $341,292 | -$179 |
| Oct 2025 | $340,693 | -$599 |
| Nov 2025 | $339,386 | -$1,307 |
| Dec 2025 | $338,122 | -$1,264 |
| Jan 2026 | $337,183 | -$939 |
| Feb 2026 | $336,335 | -$848 |
The steepest drops came in the spring and early summer of 2025, with May losing $2,501 in a single month. The declines slowed through late summer — August and September barely moved — then picked up again in the fall.
The most recent months show losses of $800 to $1,300 per month. Not accelerating, but not flattening out either. The market hasn’t found its floor.
Over the full 12 months, Savannah shed $13,797 in median value. That’s a 3.9% decline from $350,132 to $336,335.
Is Savannah a Good Place to Buy in 2026?
The data points toward a buyer’s market. Prices are falling, population growth is flat, and the gap between the cheapest and most expensive neighborhoods gives buyers real options.
If you’re looking under $250,000, ZIP 31415 at $141,040 and ZIP 31404 at $249,802 are your targets. Both also make sense for investors — the rent-to-price ratios are strong enough that rental income covers or exceeds mortgage payments.
If you’re buying to live in, the falling market means you have negotiating power. A 3.9% annual decline translates to real savings if you wait even a few months. But timing a bottom is always a gamble.
The risk? Savannah’s population isn’t growing fast enough to drive a rebound. Without a surge in demand, prices could keep drifting lower through 2026.
For cash buyers and long-term holders, the current numbers are reasonable. For anyone counting on quick appreciation, the data says hold off.
Savannah Housing Market Outlook for 2026-2027
The 12-month trend shows consistent monthly declines with no sign of reversal. If the current pace of $800 to $1,300 per month continues, the median could slip below $330,000 by mid-2026.
The late-summer slowdown in 2025 — when monthly drops shrank to just $179 in September — hints that seasonal demand can briefly stabilize prices. You might see a similar pause in summer 2026.
But the broader trajectory is clear. The three-month trend from December through February averaged about $900 in losses per month. That’s moderate but persistent.
A realistic range for late 2026 sits between $320,000 and $335,000, assuming no major economic shift in the Savannah metro. Population growth isn’t strong enough to absorb inventory and push prices back up.
Similar Markets in GA
If you’re shopping in Georgia, these cities offer different price points.
- Atlanta — Georgia’s largest market with 4.0% population growth, giving you more inventory to choose from.
- Augusta — A smaller metro east of Savannah that often runs cheaper.
- Columbus — Western Georgia, typically below Savannah’s price range.
- Athens — College-town market with 1.1% growth, similar to Savannah’s pace.
- Warner Robins — The fastest-growing city on this list at 7.0%, a sign of rising demand.
Frequently Asked Questions
What is the average home price in Savannah?
The average home price in Savannah is $336,335 as of February 2026. That figure represents the citywide median across seven tracked ZIP codes. Prices range from $141,040 in ZIP 31415 to $559,204 in ZIP 31401.
Are home prices going up or down in Savannah?
Down. Savannah home prices have fallen 3.9% year over year, dropping from $350,132 in March 2025 to $336,335 in February 2026. Every single month in that 12-month window recorded a decline.
Is it cheaper to rent or buy in Savannah?
At the citywide median, renting is cheaper. A mortgage on a $336,335 home costs roughly $2,210 per month, while the average rent runs about $1,759. However, in the two most affordable ZIPs — 31415 and 31404 — buying is actually cheaper than renting.
What is the most affordable neighborhood in Savannah?
ZIP code 31415 is the most affordable at $141,040 — less than half the city median. Despite low home prices, rents there average $1,696, making it one of the strongest rent-to-price ratios in the city at 1.20%.
Methodology
Home values are based on the Zillow Home Value Index (ZHVI), a smoothed measure of typical home values in the 35th to 65th percentile range. Rent estimates use the Zillow Observed Rent Index (ZORI). Population figures come from the U.S. Census Bureau Population Estimates Program (2020-2024 vintage). All datasets are publicly available. Housing data updated 2026-02-28.