Augusta Home Prices: $157K, Up 0.4% — 4 ZIPs Analyzed (2026)
$157,048. That’s what a typical home costs in Augusta, GA — less than a luxury car and well below the national median. Prices ticked up just 0.4% over the past year. For buyers priced out of Atlanta, this city on the South Carolina border remains one of the more accessible markets in Georgia.
Quick answer: The average home price in Augusta, GA is $157,048 as of February 2026, up 0.4% year over year according to Zillow.
Current Home Prices in Augusta
Augusta’s housing market is flat. A 0.4% annual gain barely keeps pace with inflation, which means real purchasing power for buyers has stayed roughly the same.
| Metric | Value |
|---|---|
| Median Home Price | $157,048 |
| Year-over-Year Change | +0.4% |
| Lowest ZIP Median | $66,783 |
| Highest ZIP Median | $261,222 |
| ZIP Codes Tracked | 4 |
| Data as of | February 2026 |
The gap between the cheapest and most expensive ZIP is nearly $195,000. That’s a 4:1 ratio — unusual for a mid-sized city. It tells you that “Augusta” is not one market. It’s several, stacked on top of each other.
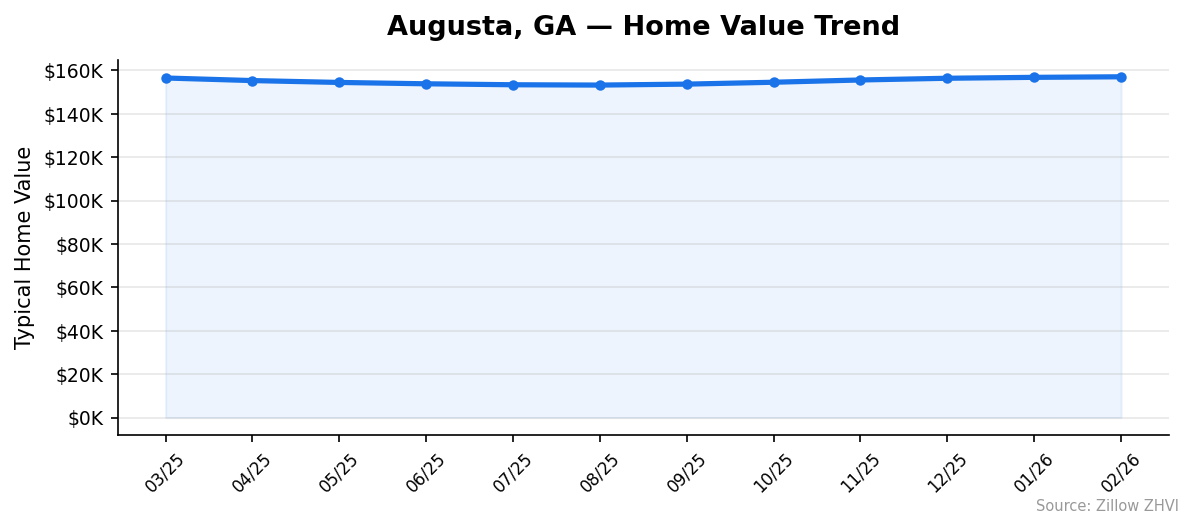
A year ago, the metro-wide median sat around $156,400. The gain since then amounts to roughly $650. Month to month, prices have been creeping up since bottoming out in August 2025 at $153,230. The recovery has been slow but consistent — six straight months of gains heading into spring 2026.
Augusta Home Prices by Neighborhood
Four ZIP codes carry enough transaction volume for reliable estimates. Here’s how they compare:
| ZIP Code | Median Home Value | Monthly Rent |
|---|---|---|
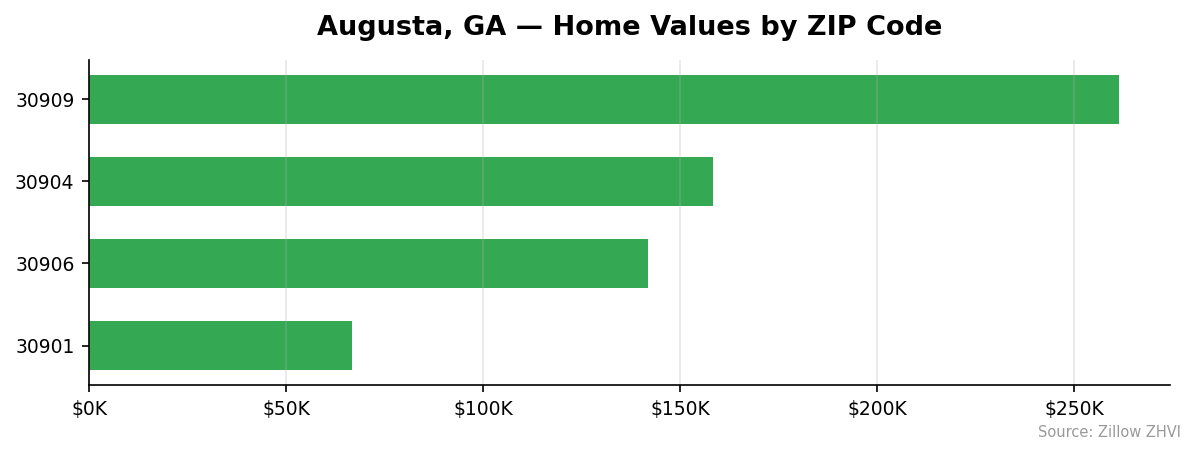
| 30901 | $66,783 | $1,122 |
| 30904 | $158,412 | $1,347 |
| 30906 | $141,776 | $1,400 |
| 30909 | $261,222 | $1,348 |
Most Expensive
30909 leads at $261,222 — 66% above the city median. Despite having the highest home values, rent here is $1,348/month, actually lower than 30906. That spread between home price and rent suggests owners in 30909 are buying for appreciation and lifestyle, not rental yield.
Most Affordable
30901 is the clear outlier at $66,783. That’s 57% below the city median and less than a quarter of what you’d pay in 30909. Rent in 30901 is also the lowest at $1,122/month, but the rent-to-price ratio here is extremely high — a signal that this area draws more renters than buyers.
30906 comes in at $141,776, about 10% under the city average. Interestingly, it has the highest rent of any ZIP at $1,400/month. If you’re an investor, that combination — below-average purchase price, above-average rent — is worth a closer look.
Rent vs Buy in Augusta
Renting and buying costs in Augusta are close enough that the math actually matters.
| ZIP Code | Monthly Rent | Est. Mortgage Payment* |
|---|---|---|
| 30901 | $1,122 | ~$450 |
| 30904 | $1,347 | ~$1,060 |
| 30906 | $1,400 | ~$950 |
| 30909 | $1,348 | ~$1,750 |
*Estimated principal and interest on a 30-year mortgage at 7%, 20% down. Does not include taxes, insurance, or maintenance.
In three of four ZIP codes, the estimated mortgage payment comes in below rent. The exception is 30909, where the $261K price tag pushes monthly payments well above the $1,348 rent.
The city-wide picture: with a median of $157,048, a 20% down payment is about $31,400. Your monthly principal and interest would run roughly $835. Add property taxes and insurance and you’re probably around $1,100–$1,150 — right in line with the lowest rents in the city.
For 30901 specifically, the numbers are striking. At $66,783, a mortgage costs about $450/month before taxes and insurance. Rent is $1,122. That’s a gap of $670/month favoring buyers. The catch: financing on homes that inexpensive can be harder to obtain, and maintenance costs eat into the savings.
Augusta Housing Market Trends
Here’s how the city-wide median moved over the past 12 months:
| Month | Median Price | Change from Prior Month |
|---|---|---|
| Feb 2026 | $157,048 | +$254 |
| Jan 2026 | $156,794 | +$421 |
| Dec 2025 | $156,373 | +$793 |
| Nov 2025 | $155,580 | +$1,045 |
| Oct 2025 | $154,535 | +$866 |
| Sep 2025 | $153,669 | +$439 |
| Aug 2025 | $153,230 | -$147 |
| Jul 2025 | $153,377 | -$440 |
| Jun 2025 | $153,817 | -$625 |
| May 2025 | $154,442 | -$860 |
| Apr 2025 | $155,302 | -$1,187 |
| Mar 2025 | $156,489 | — |
The pattern is clear. Prices dropped from March through August 2025, shedding about $3,260 over five months. Then the direction reversed. Since the August bottom, Augusta has gained $3,818 — more than erasing the spring-summer decline.
The monthly gains have been decelerating, though. November added over $1,000. February added just $254. The recovery is slowing as prices approach their March 2025 level.
Is Augusta a Good Place to Buy in 2026?
The data points to a balanced market leaning slightly toward buyers.
A 0.4% annual gain is essentially flat. Sellers aren’t getting bidding wars. Buyers aren’t seeing discounts. The price range across ZIP codes — $67K to $261K — means you can enter the market at almost any budget level.
For first-time buyers, Augusta offers something rare: a median price well below $200K in a state where Atlanta pushes $400K+. The rent-vs-buy math favors ownership in most neighborhoods. And the slow, steady price recovery since August 2025 suggests the floor is in.
The risk? Flat appreciation means your home may not build equity quickly. If you’re buying as an investment, the rental yields in 30901 and 30906 look more interesting than the appreciation play.
Augusta Housing Market Outlook for 2026-2027
The six-month upward trend from August 2025 through February 2026 is intact, but momentum is fading. Monthly gains shrank from $1,045 in November to $254 in February.
If the current pace continues, Augusta’s median could reach $158,000–$159,000 by summer 2026. That would put it back above the March 2025 level of $156,489 — effectively a full round trip.
The 3-month trend suggests spring 2026 won’t bring a sudden acceleration. The gains are there, just modest. A slow grind upward is the most likely path unless mortgage rates shift significantly in either direction.
Don’t expect double-digit appreciation here. Augusta’s market has been range-bound between $153K and $157K for a full year. Stability is the story, not growth.
Similar Markets in GA
If you’re shopping in Georgia, these cities offer useful comparisons to Augusta’s $157K median:
- Columbus — Another mid-sized Georgia city near the Alabama border with a military presence similar to Augusta’s Fort Eisenhower influence.
- Warner Robins — A smaller market south of Macon, also shaped by a major military base (Robins AFB).
- Savannah — Coastal Georgia with higher prices but a different lifestyle tradeoff for buyers willing to spend more.
- Athens — A college-town market with rental demand driven by UGA students and faculty.
- Atlanta — The state’s largest market and a useful benchmark, though prices run significantly higher than Augusta.
Frequently Asked Questions
What is the average home price in Augusta?
The average home price in Augusta is $157,048 as of February 2026. That figure represents the metro-wide median across four tracked ZIP codes, where values range from $66,783 in 30901 to $261,222 in 30909.
Are home prices going up or down in Augusta?
Prices are up 0.4% year over year. After declining from March through August 2025, the market reversed course and has posted six consecutive months of gains. The recovery has been gradual, with the largest monthly jump ($1,045) occurring in November 2025.
Is it cheaper to rent or buy in Augusta?
In most of Augusta, buying is cheaper than renting. The estimated mortgage payment on the median-priced home runs about $1,100–$1,150/month including taxes and insurance. Average rents range from $1,122 to $1,400 depending on the ZIP code. The one exception is 30909, where the $261K median makes monthly ownership costs exceed typical rents.
What is the most affordable neighborhood in Augusta?
ZIP code 30901 is by far the most affordable, with a median home value of $66,783. That’s 57% below the city-wide median. Rent in 30901 is $1,122/month — also the lowest in the city. The wide gap between low home prices and relatively high rents makes this area stand out for potential rental investors.
Methodology
Home values are based on the Zillow Home Value Index (ZHVI), a smoothed measure of typical home values in the 35th to 65th percentile range. Rent estimates use the Zillow Observed Rent Index (ZORI). Population figures come from the U.S. Census Bureau Population Estimates Program (2020-2024 vintage). All datasets are publicly available. Housing data updated 2026-02-28.