Flagstaff Home Prices: $666K, Up 0.5% — 3 ZIPs Analyzed (2026)
$666,182. That’s the typical home value in Flagstaff as of February 2026, and it’s barely budged — up just 0.5% from a year ago. After a steady climb through 2025, the market has cooled to a near standstill heading into spring.
Quick answer: The average home price in Flagstaff, AZ is $666,182 as of February 2026, up 0.5% year over year according to Zillow.
Current Home Prices in Flagstaff
The numbers tell a story of a market that’s run out of fuel. Prices peaked at $666,869 in December 2025 and have edged down for two straight months. The annual gain of 0.5% is well below the rate of inflation, meaning Flagstaff homeowners are losing purchasing power even as nominal values hold.
| Metric | Value |
|---|---|
| Median home value | $666,182 |
| Year-over-year change | +0.5% |
| Lowest ZIP median | $613,014 |
| Highest ZIP median | $722,098 |
| ZIP codes tracked | 3 |
| Data through | February 2026 |
The spread between Flagstaff’s cheapest and priciest ZIPs is roughly $109,000 — about 18% of the median. That’s a relatively tight band for a city where elevation, university proximity, and resort access can swing values block by block.
For context, $666K puts Flagstaff among the more expensive markets in Arizona. It sits well above Phoenix-area suburbs like Glendale and Peoria despite having a fraction of the population. The northern Arizona premium is real, and the data confirms it has held even as price growth has stalled.
You’re looking at a market where the typical buyer needs roughly $133,000 down for a 20% conventional loan. At current rates, the monthly principal and interest on the remaining $533,000 lands north of $3,500 — before taxes, insurance, or HOA dues.
Flagstaff Home Prices by Neighborhood
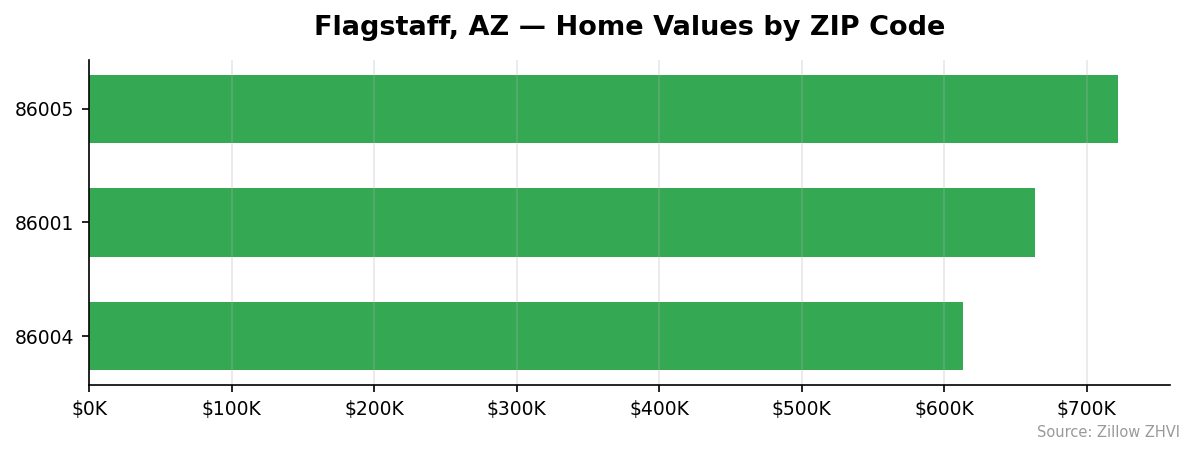
Three ZIP codes cover the Flagstaff market. Here’s how they compare:
| ZIP Code | Median Home Value | Median Rent | vs. City Median |
|---|---|---|---|
| 86005 | $722,098 | $2,080 | +8.4% |
| 86001 | $663,435 | $2,357 | -0.4% |
| 86004 | $613,014 | $2,063 | -8.0% |
Most Expensive
86005 tops the list at $722,098 — that’s the south/southwest side including Kachina Village and the Forest Highlands area, where larger lots and resort-adjacent properties pull the median up. Despite the highest home values, rents here are actually the second-lowest in town at $2,080, suggesting more owner-occupied housing than rental stock.
86001 sits in the middle at $663,435, essentially matching the city average. This ZIP covers downtown and the Northern Arizona University corridor, which explains why it commands the highest rents in Flagstaff at $2,357.
Most Affordable
86004 is the budget option at $613,014, running 8% below the city median. The east-side ZIP also has the lowest typical rent at $2,063. For buyers priced out of the south side, this is where the math gets closest to working.
Rent vs Buy in Flagstaff
Renting wins on monthly cash flow — and it’s not close.
The average rent across Flagstaff’s three ZIPs is roughly $2,167. Compare that to the carrying cost of a median-priced home: with 20% down on a $666,182 purchase, you’re looking at a mortgage near $3,540 at current rates, plus property taxes, insurance, and maintenance that easily push the monthly cost past $4,200.
| Cost Type | Monthly |
|---|---|
| Average rent (all ZIPs) | ~$2,167 |
| Mortgage on median home (20% down) | ~$3,540 |
| Estimated total ownership cost | ~$4,200+ |
That’s a gap of more than $2,000 a month between renting and owning.
The break-even math depends on how long you stay. With prices rising just 0.5% annually, appreciation isn’t doing the heavy lifting it once did. A buyer counting on equity gains to offset the monthly premium would need years of holding — and faster price growth — to come out ahead.
For a renter saving the $2,000 monthly difference, that’s $24,000 a year going into investments instead of a mortgage. Over five years at modest market returns, the renter’s pile could rival the equity built by the buyer.
The trade-off is stability. Rent in Flagstaff isn’t cheap either, and rental supply near NAU runs tight during the academic year. Buyers get fixed payments and control. Renters get flexibility and a much smaller monthly check.
Population Growth and Migration
Flagstaff is growing — slowly. The Census estimates show 77,539 residents in 2024, up from 77,091 in 2020. That’s a 0.6% gain over four years, or roughly 112 net new residents per year.
| Year | Population |
|---|---|
| 2020 | 77,091 |
| 2021 | 74,817 |
| 2022 | 76,035 |
| 2023 | 76,819 |
| 2024 | 77,539 |
The city actually lost population in 2021 — dropping below 75,000 — before recovering each year since. The 2024 figure has not quite returned to peak Phoenix-metro-style growth rates seen elsewhere in Arizona.
| City | 2024 Population | 4-Year Growth |
|---|---|---|
| Surprise | 167,564 | +16.0% |
| Gilbert | 288,790 | +7.2% |
| Peoria | 199,924 | +4.1% |
| Phoenix | 1,673,164 | +3.8% |
| Glendale | 258,143 | +3.7% |
| Flagstaff | 77,539 | +0.6% |
That comparison matters. While Phoenix-area suburbs added thousands of residents, Flagstaff’s growth has been a trickle. Geographic constraints — surrounded by national forest, limited buildable land — keep supply tight even when demand is modest.
Slow population growth combined with limited new construction explains why prices held up despite affordability pressure. There simply isn’t much new inventory hitting the market.
Flagstaff Housing Market Trends
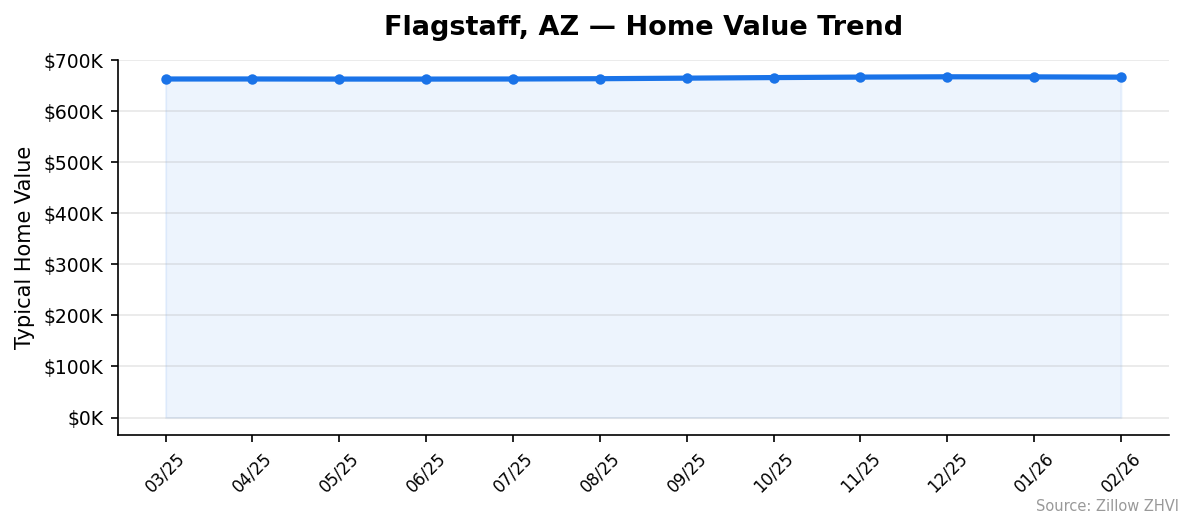
The 12-month trend shows a market that ran out of momentum.
| Month | Median Value |
|---|---|
| Feb 2026 | $666,182 |
| Jan 2026 | $666,676 |
| Dec 2025 | $666,869 |
| Nov 2025 | $666,267 |
| Oct 2025 | $665,338 |
| Sep 2025 | $664,208 |
| Aug 2025 | $663,111 |
| Jul 2025 | $662,555 |
| Jun 2025 | $662,376 |
| May 2025 | $662,399 |
| Apr 2025 | $662,591 |
| Mar 2025 | $662,551 |
From March through July 2025, the median moved less than $200. Prices then climbed roughly $4,300 from July to December — a quiet uptrend of about 0.65%. Since the December peak, values have slipped two months in a row.
That December high of $666,869 is now the line to watch. If the next few prints stay below it, you can call this a top. If buyers return in spring and push past it, the flat phase extends.
The full-year change of 0.5% means buyers who bought in March 2025 have gained about $3,600 in paper equity. Subtract closing costs and they’re underwater on the trade.
Is Flagstaff a Good Place to Buy in 2026?
The data points to a market in balance — neither a clear buyer’s nor seller’s market.
Prices are flat. Inventory is tight (geographic constraints). Rent is roughly half the cost of owning. Population is growing slowly. None of those factors scream “buy now” or “wait.”
If you’re a long-term buyer planning to stay 7+ years, the flat market is actually an entry point. You’re not paying a premium for momentum. If you’re shorter-term, the rent-vs-buy gap argues against ownership at these prices.
Sellers face a harder pitch. With the December peak two months back and YoY growth at just 0.5%, listing aggressively means sitting. Pricing at or below the local ZIP median is the safer move.
The most affordable path is ZIP 86004 at $613K. The premium pick is 86005 at $722K. The middle is 86001 with the highest rents — useful if you plan to house-hack or rent a room.
Flagstaff Housing Market Outlook for 2026-2027
The 3-month trend points slightly down. February’s $666,182 is below January’s $666,676 and December’s $666,869 — small declines, but consecutive.
If the current pace continues, Flagstaff could finish the first half of 2026 in the $660K-$665K range. That would mark the first sustained pullback in the data.
The factors pushing this direction: stalled YoY growth, two consecutive monthly declines, and rent levels that don’t support the buy-side math. The factors pushing back: limited supply from geographic constraints and a population base that keeps inching up.
A spring bounce is possible — Flagstaff sees seasonal demand from second-home buyers and summer-residents. Watch the March and April prints. If they break above December’s $666,869, the cool-down was a head fake. If they don’t, the top is in.
Similar Markets in AZ
If Flagstaff’s $666K median is out of reach, Arizona has cheaper options:
- Yuma — Far southwest corner, typically among the most affordable Arizona markets.
- Tucson — Larger metro, generally lower prices than Flagstaff with more inventory.
- Casa Grande — Halfway between Phoenix and Tucson, a budget alternative.
- Phoenix — Larger market with more variety; some suburbs price below Flagstaff.
- Mesa — Established Phoenix suburb with broader price ranges.
Frequently Asked Questions
What is the average home price in Flagstaff?
The average home price in Flagstaff, AZ is $666,182 as of February 2026. That number is drawn from the Zillow Home Value Index across three ZIP codes, with values ranging from $613,014 in ZIP 86004 to $722,098 in ZIP 86005.
Are home prices going up or down in Flagstaff?
Prices are up 0.5% year over year — essentially flat. The median actually peaked at $666,869 in December 2025 and has slipped for two consecutive months since, a sign the recent uptrend may be ending.
Is it cheaper to rent or buy in Flagstaff?
Renting is far cheaper on a monthly basis. The average rent across Flagstaff’s three ZIPs is around $2,167, while the carrying cost on a median-priced home runs over $4,200 monthly with a 20% down payment — a gap of more than $2,000 a month favoring renters.
What is the most affordable neighborhood in Flagstaff?
ZIP 86004 is the cheapest at $613,014, roughly 8% below the citywide median. It also has the lowest median rent at $2,063, making it the most accessible Flagstaff ZIP for both buyers and renters.
Methodology
Home values are based on the Zillow Home Value Index (ZHVI), a smoothed measure of typical home values in the 35th to 65th percentile range. Rent estimates use the Zillow Observed Rent Index (ZORI). Population figures come from the U.S. Census Bureau Population Estimates Program (2020-2024 vintage). All datasets are publicly available. Housing data updated 2026-02-28.