Jefferson City Home Prices: $273K, Up 2.6% — 4 ZIPs Analyzed (2026)
$273,055. That’s what a typical home costs in Jefferson City, Missouri as of February 2026, and the number is up 2.6% from a year ago. The state capital has been quietly climbing for most of the past year while the broader market has bounced around.
Quick answer: The average home price in Jefferson City, MO is $273,055 as of February 2026, up 2.6% year over year according to Zillow.
Current Home Prices in Jefferson City
The citywide median sits at $273,055. That figure blends four ZIP codes, with values ranging from $261,284 on the low end to $283,576 on the high end. The spread is narrow — about $22,000 separates the cheapest neighborhood from the priciest.
| Metric | Value |
|---|---|
| Median home value | $273,055 |
| Year-over-year change | +2.6% |
| Lowest ZIP value | $261,284 |
| Highest ZIP value | $283,576 |
| ZIP codes tracked | 4 |
| Data as of | February 2026 |
A 2.6% annual gain is modest. It outpaces inflation in some months and trails it in others, but it’s a real increase rather than a flat market. For comparison, the home you could buy here a year ago for $266,000 now costs about $7,000 more.
The price band tells you something about the city. Jefferson City does not have a luxury tier pulling the average up, and it does not have a distressed pocket dragging it down. Most homes trade in a fairly tight $260K–$285K window. If you’re shopping here, you’re shopping in that range.
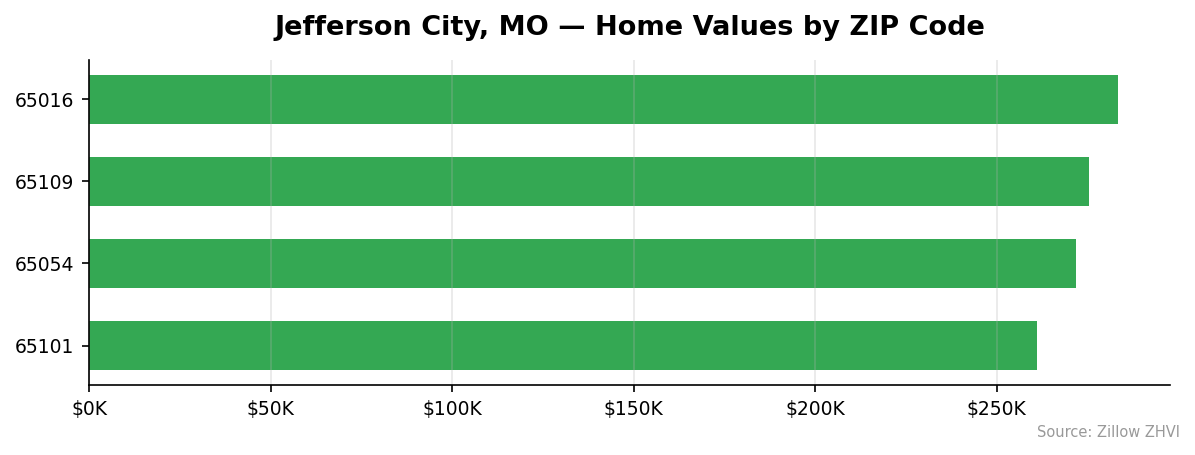
Jefferson City Home Prices by Neighborhood
Four ZIP codes make up the local market. Here’s how they stack up.
| ZIP Code | Median Value | Avg Rent |
|---|---|---|
| 65016 | $283,576 | — |
| 65109 | $275,357 | $1,110 |
| 65054 | $272,004 | — |
| 65101 | $261,284 | $853 |
Most Expensive
65016 — $283,576. This is the priciest ZIP, sitting roughly $10,500 above the citywide median. It’s the only area trading above $280K.
65109 — $275,357. The west side ZIP runs about $2,300 above the median and pulls the highest rents in the city at $1,110.
65054 — $272,004. Just below the citywide average, essentially a mid-tier price point.
Most Affordable
65101 — $261,284. The downtown and east side ZIP is the cheapest by a clear margin — nearly $12,000 below the median. Rents here also undercut the rest of town at $853.
65054 — $272,004. Slightly below the median, but only by about $1,000.
65109 — $275,357. Marginally above average, but still well under the priciest ZIP.
Rent vs Buy in Jefferson City
Average rent across the two ZIPs with data is about $981 per month. ZIP 65109 rents for $1,110, ZIP 65101 for $853. That’s the monthly cost of leasing a typical home here.
Now the buy side. On a $273,055 home with 20% down ($54,611), the loan amount is $218,444. At a 7% mortgage rate over 30 years, principal and interest run about $1,453. Add property taxes (Jefferson City sits in Cole County, where rates run roughly 1% of value, so about $228 per month) and homeowner’s insurance (call it $100), and the all-in monthly payment lands near $1,780.
That’s an $800 monthly gap between renting and buying. Over a year, that’s nearly $9,600.
| Cost | Rent (avg) | Buy (P&I + tax + ins) |
|---|---|---|
| Monthly | $981 | ~$1,780 |
| Annual | $11,772 | ~$21,360 |
Renting wins on cash flow. Buying makes sense if you stay long enough for appreciation and equity buildup to overtake that gap. With prices rising 2.6% annually, a $273K home gains about $7,100 per year in value — which roughly closes the gap once you factor in equity from principal payments. The break-even is real but not fast.
Population Growth and Migration
Jefferson City has 42,564 residents as of the 2024 Census estimate. That’s up from 42,528 in 2020 — a gain of just 36 people over four years, or 0.1%.
| Year | Population |
|---|---|
| 2020 | 42,528 |
| 2021 | 42,394 |
| 2022 | 42,536 |
| 2023 | 42,573 |
| 2024 | 42,564 |
The city dipped in 2021, recovered in 2022, peaked in 2023, and ticked down slightly in 2024. Call it flat. There’s no growth story here, but no decline either.
How does that compare to other Missouri cities?
| City | 2024 Population | 4-Year Growth |
|---|---|---|
| Lee’s Summit | 106,419 | +4.8% |
| O’Fallon | 95,355 | +4.0% |
| Columbia | 130,900 | +3.6% |
| St. Peters | 61,398 | +6.4% |
| St. Charles | 72,458 | +2.4% |
| Jefferson City | 42,564 | +0.1% |
Every nearby Missouri city in this comparison is growing faster. The state’s growth is concentrated in the Kansas City and St. Louis exurbs, not the capital. For housing demand, flat population means demand is driven more by household formation, retirement moves, and government employment than by population influx. That helps explain the steady-but-modest 2.6% price growth — there’s no demand surge pushing prices up sharply.
Jefferson City Housing Market Trends
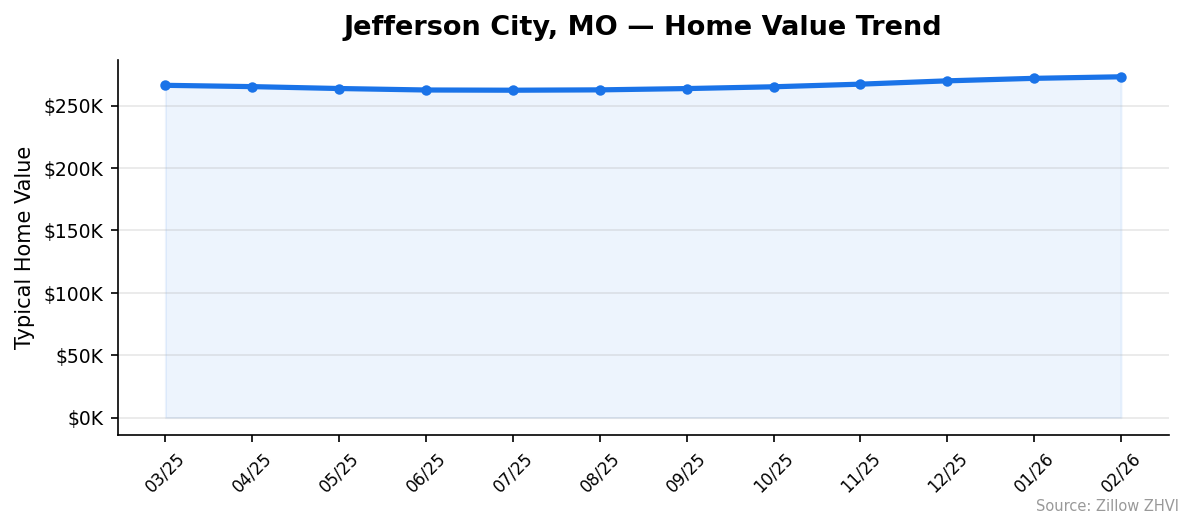
Here’s the 12-month trajectory.
| Month | Median |
|---|---|
| Feb 2026 | $273,055 |
| Jan 2026 | $271,814 |
| Dec 2025 | $269,810 |
| Nov 2025 | $267,147 |
| Oct 2025 | $265,052 |
| Sep 2025 | $263,615 |
| Aug 2025 | $262,574 |
| Jul 2025 | $262,299 |
| Jun 2025 | $262,474 |
| May 2025 | $263,651 |
| Apr 2025 | $265,177 |
| Mar 2025 | $266,218 |
The pattern is clear. Prices declined from March through July 2025, hit bottom around $262,000, and have climbed every month since. February 2026 is the highest reading in the data series.
That’s seven straight months of monthly gains. The pace has accelerated, too — recent months show $1,200 to $2,600 increases versus the smaller drops earlier in the year.
If you bought at the July 2025 low, you’re up about $10,800. If you sold then, you missed the rebound.
Is Jefferson City a Good Place to Buy in 2026?
Prices are rising but not aggressively. A 2.6% annual gain won’t make anyone rich quickly, and it won’t price you out either. The market here moves slowly in both directions.
The narrow ZIP range (about $22K from cheapest to priciest) means you don’t get punished for picking the “wrong” neighborhood. You also don’t get a steep discount for picking the cheapest one.
Renting is meaningfully cheaper month-to-month, so if you’re not sure you’ll stay 5+ years, the math favors leasing. If you are committed to the area — government workers, established locals, retirees — buying at this price level is reasonable. The flat population growth means you’re not betting on rapid appreciation, just steady ownership.
This is a buyer’s market in tone (no bidding-war pressure, modest inventory turnover) but a seller’s market in trajectory (seven months of price gains). It’s balanced.
Jefferson City Housing Market Outlook for 2026-2027
The 3-month trend shows monthly gains of roughly $1,200 to $2,600. If the current pace continues, prices could push toward the $278K–$282K range by mid-2026.
That said, momentum can stall. The market dropped from March through July 2025 before reversing. A similar mid-year softening would not be surprising given the city’s flat demographics.
Watch for whether the gain rate holds at $1,500+ per month or slows to under $1,000. The first signals continued upward pressure. The second suggests a plateau near current levels.
The 2.6% annual gain has been remarkably consistent with what slow-growth, government-anchored markets typically produce. Expect more of the same unless rates move sharply or the state employment picture shifts.
Similar Markets in MO
- Columbia — A bigger college town 30 miles north, growing faster than Jefferson City and worth checking for buyers wanting more amenities.
- Springfield — Southern Missouri’s largest market, useful for comparing pricing in a city with more economic diversity.
- Saint Joseph — Another mid-sized Missouri city with similar pricing dynamics.
- Independence — A Kansas City suburb that gives a feel for prices in the metro area.
- Poplar Bluff — A smaller market in southeast Missouri, useful as a lower-priced comparison.
Frequently Asked Questions
What is the average home price in Jefferson City?
The average home price in Jefferson City, MO is $273,055 as of February 2026. That blends data from four local ZIP codes ranging from $261,284 to $283,576.
Are home prices going up or down in Jefferson City?
Prices are up 2.6% year over year. The market has gained ground every month since July 2025, when the median hit a low of $262,299.
Is it cheaper to rent or buy in Jefferson City?
Renting is cheaper monthly. Average rent runs about $981 versus a roughly $1,780 mortgage payment on a typical home with 20% down — a gap of about $800 per month before factoring in equity buildup and appreciation.
What is the most affordable neighborhood in Jefferson City?
ZIP 65101, which covers downtown and east Jefferson City, is the cheapest at $261,284. It also has the lowest rents in town at $853 per month, about $260 less than the west-side ZIP 65109.
Methodology
Home values are based on the Zillow Home Value Index (ZHVI), a smoothed measure of typical home values in the 35th to 65th percentile range. Rent estimates use the Zillow Observed Rent Index (ZORI). Population figures come from the U.S. Census Bureau Population Estimates Program (2020-2024 vintage). All datasets are publicly available. Housing data updated 2026-02-28.