Glendale Home Prices: $401K, Down 2.5% — 8 ZIPs Analyzed (2026)
Can you still afford a house in Glendale? At $400,682, the typical home costs less than you’d expect for a city inside the Phoenix metro — and prices are sliding.
The median dropped 2.5% over the past year. That’s roughly $10,000 off the price tag compared to March 2025, when values peaked at $411K.
Quick answer: The average home price in Glendale, AZ is $400,682 as of February 2026, down 2.5% year over year according to Zillow.
Current Home Prices in Glendale
Here’s a snapshot of where the market stands right now.
| Metric | Value |
|---|---|
| Median Home Value | $400,682 |
| Year-over-Year Change | -2.5% |
| Lowest ZIP Median | $310,522 |
| Highest ZIP Median | $471,182 |
| Number of ZIPs Tracked | 8 |
| Data as of | February 2026 |
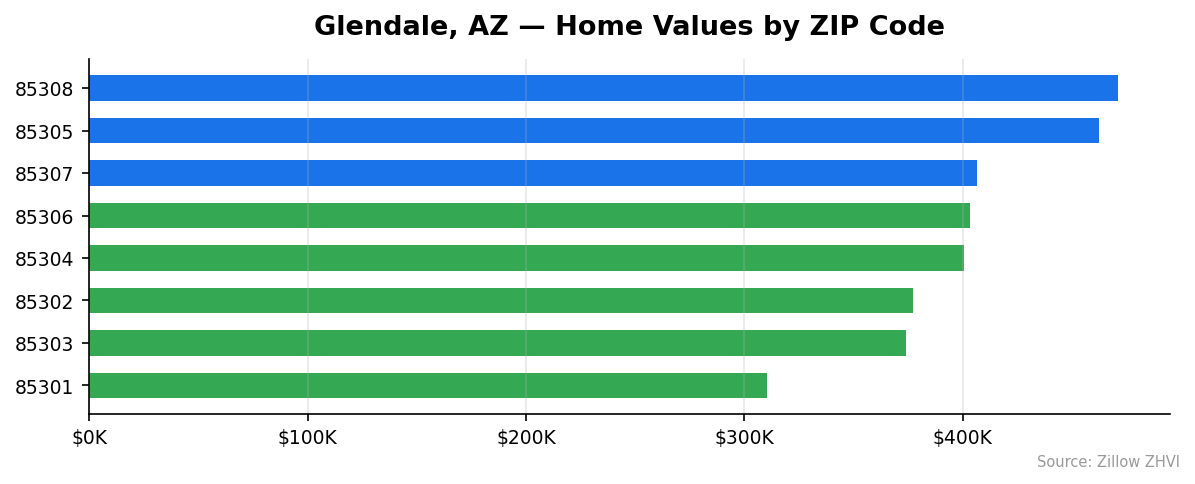
The $160,660 spread between the cheapest and most expensive ZIP codes tells you something: Glendale is not one market. The west side near Luke Air Force Base and the older downtown core sit well below $400K. The northern neighborhoods push toward $470K.
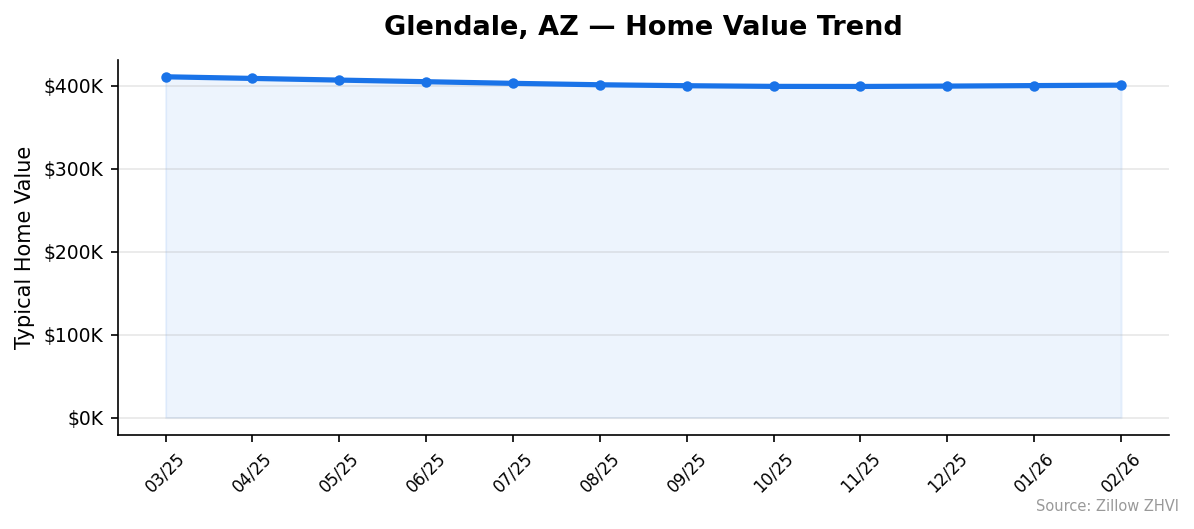
That 2.5% annual decline puts Glendale in line with the broader Phoenix metro correction. Values peaked around April-May 2025 and have been grinding lower since. The decline is steady, not steep — about $10K over twelve months.
For context, the March 2025 citywide average was $410,752. By February 2026, it had fallen to $400,682. That’s a loss of $10,070 in value for the typical homeowner.
Glendale Home Prices by Neighborhood
Not all ZIP codes are moving in the same direction or at the same speed. Here’s the full breakdown.
| ZIP Code | Median Home Value | Typical Rent |
|---|---|---|
| 85301 | $310,522 | $1,166/mo |
| 85302 | $377,209 | $1,479/mo |
| 85303 | $373,884 | $1,880/mo |
| 85304 | $400,721 | $2,188/mo |
| 85305 | $462,331 | $1,631/mo |
| 85306 | $403,229 | $1,483/mo |
| 85307 | $406,379 | $1,613/mo |
| 85308 | $471,182 | $1,639/mo |
Most Expensive ZIPs
85308 leads at $471,182 — about 18% above the city average. Rents here run $1,639/month, relatively moderate for the price level.
85305 comes in at $462,331, the second priciest neighborhood. Rent is $1,631/month, nearly identical to 85308 despite a $9K gap in home values.
85307 rounds out the top three at $406,379. It sits just above the citywide median, with rents at $1,613/month.
Most Affordable ZIPs
85301 is the clear budget pick at $310,522 — a full $90K below the city average. Rent here is also the lowest at $1,166/month.
85303 comes next at $373,884. An interesting quirk: rent in 85303 is $1,880/month, significantly higher than neighborhoods with more expensive homes.
85302 at $377,209 is the third most affordable. Rent runs $1,479/month, a more typical ratio for its price point.
Rent vs Buy in Glendale
Let’s do the math. A $400,682 home with 20% down means a $320,546 mortgage. At a 6.5% rate on a 30-year fixed, your monthly principal and interest payment is about $2,027. Add property taxes and insurance, and you’re looking at roughly $2,400-$2,500/month all in.
Rents across Glendale’s eight ZIP codes range from $1,166 to $2,188/month.
| ZIP | Monthly Rent | Est. Mortgage (P&I) | Difference |
|---|---|---|---|
| 85301 | $1,166 | $1,573 | Rent saves $407/mo |
| 85302 | $1,479 | $1,910 | Rent saves $431/mo |
| 85303 | $1,880 | $1,893 | Nearly equal |
| 85304 | $2,188 | $2,030 | Buying saves $158/mo |
| 85305 | $1,631 | $2,342 | Rent saves $711/mo |
| 85306 | $1,483 | $2,041 | Rent saves $558/mo |
| 85307 | $1,613 | $2,057 | Rent saves $444/mo |
| 85308 | $1,639 | $2,386 | Rent saves $747/mo |
Mortgage estimates assume 20% down and 6.5% interest, principal and interest only.
In most of Glendale, renting is cheaper on a monthly basis. The exception is 85304, where high rents ($2,188) actually make buying the better deal. In 85303, the two costs are nearly identical.
The biggest gap is in 85308: you’d save $747/month by renting instead of buying. That said, renters don’t build equity — so the calculation depends on how long you plan to stay.
Population Growth and Migration
Glendale added 9,205 residents between 2020 and 2024, growing from 248,938 to 258,143. That’s a 3.7% increase over four years.
| Year | Population |
|---|---|
| 2020 | 248,938 |
| 2021 | 249,842 |
| 2022 | 252,162 |
| 2023 | 255,001 |
| 2024 | 258,143 |
Growth has been steady — roughly 2,000 to 3,000 new residents per year with no signs of slowing.
How does that compare to neighbors?
| City | 2024 Population | 4-Year Growth |
|---|---|---|
| Goodyear | 118,186 | +20.8% |
| Surprise | 167,564 | +16.0% |
| Gilbert | 288,790 | +7.2% |
| Peoria | 199,924 | +4.1% |
| Phoenix | 1,673,164 | +3.8% |
| Glendale | 258,143 | +3.7% |
Glendale’s growth rate is modest compared to the West Valley boomtowns. Goodyear grew nearly six times faster. Surprise added residents at four times the rate. But Glendale is a larger, more established city — 3.7% growth on a base of 249K means more actual people than Goodyear’s 20.8% on a smaller base.
Steady population growth supports housing demand, but the slow pace explains why prices aren’t surging. Supply is keeping up.
Glendale Housing Market Trends
Here’s the month-by-month picture over the past year.
| Month | Average Home Value | Low ZIP | High ZIP |
|---|---|---|---|
| Mar 2025 | $410,752 | $320,203 | $482,945 |
| Apr 2025 | $408,786 | $318,325 | $480,954 |
| May 2025 | $406,766 | $316,772 | $478,739 |
| Jun 2025 | $404,821 | $315,199 | $476,270 |
| Jul 2025 | $402,855 | $313,970 | $473,384 |
| Aug 2025 | $401,137 | $312,706 | $470,916 |
| Sep 2025 | $399,978 | $311,730 | $469,380 |
| Oct 2025 | $399,195 | $310,665 | $468,684 |
| Nov 2025 | $399,096 | $310,223 | $468,729 |
| Dec 2025 | $399,527 | $310,420 | $469,477 |
| Jan 2026 | $400,139 | $310,578 | $470,443 |
| Feb 2026 | $400,682 | $310,522 | $471,182 |
The trend breaks into two phases. From March through October 2025, prices fell steadily — losing about $11,500 over seven months. Then in November, the decline bottomed out near $399K. Since then, values have ticked up slightly for three consecutive months.
The cheapest ZIP bottomed at $310,223 in November before stabilizing. The most expensive ZIP fell from $483K to $469K, then recovered to $471K.
Both ends of the market are moving in the same direction: down sharply through fall, then a mild rebound heading into 2026.
Is Glendale a Good Place to Buy in 2026?
The numbers favor buyers right now. Prices are down 2.5% year over year, which means sellers have less bargaining power than they did in early 2025. The $160K spread across ZIP codes gives you options — from entry-level in 85301 at $311K to premium in 85308 at $471K.
Renting is cheaper in six of eight ZIP codes, so there’s no urgency to buy if you’re purely optimizing monthly costs. But if you plan to stay 5+ years, the recent dip creates a better entry point than anything available in 2024 or early 2025.
The population is growing at a moderate pace, which supports long-term demand without overheating the market. You’re not buying into a speculative frenzy, and you’re not catching a falling knife — the three-month uptick suggests the correction may be leveling off.
For first-time buyers, 85301 and 85303 offer the lowest barrier to entry. For families prioritizing school districts and newer construction, 85308 and 85305 carry a premium but hold value better.
Glendale Housing Market Outlook for 2026-2027
The data shows a clear pattern: a steady decline from spring 2025, a bottom near $399K in November, and a modest rebound since. If the current pace continues — roughly $500-$600/month in gains — Glendale could return to the $403K-$405K range by summer 2026.
The three-month trend suggests the floor has been found. November, December, January, and February all came in within a tight $399K-$401K band. That kind of stability after a correction usually means the market is finding equilibrium rather than preparing for another leg down.
Don’t expect a return to the $411K highs of March 2025 anytime soon. The year-over-year decline is still negative, and the recovery is slow. But the worst of the correction appears to be behind Glendale.
Similar Markets in AZ
If you’re considering Glendale, these nearby cities offer different price points and growth profiles.
- Phoenix — The metro anchor next door, with a far larger inventory and similar pricing trends.
- Peoria — Borders Glendale to the northwest and shares several ZIP codes along the boundary.
- Surprise — Farther west with 16% population growth — a fast-growing alternative for buyers priced out of central Phoenix.
- Chandler — East Valley option popular with tech workers, generally higher prices than Glendale.
- Mesa — The East Valley’s largest city, offering a broad range of neighborhoods and price points.
Frequently Asked Questions
What is the average home price in Glendale?
The average home price in Glendale, AZ is $400,682 as of February 2026. That figure represents the Zillow Home Value Index across all eight tracked ZIP codes. Prices range from $310,522 in ZIP 85301 to $471,182 in ZIP 85308.
Are home prices going up or down in Glendale?
Prices are down 2.5% compared to one year ago. The decline started in spring 2025, with values falling from $411K in March to $399K by November. Since then, prices have ticked up slightly for three straight months, suggesting the market may be stabilizing.
Is it cheaper to rent or buy in Glendale?
In most of Glendale, renting is cheaper on a monthly basis. A mortgage on the median-priced home runs about $2,027/month (principal and interest with 20% down at 6.5%), while rents range from $1,166 to $2,188 depending on the ZIP code. Only in 85304 does buying come out ahead on monthly costs.
What is the most affordable neighborhood in Glendale?
ZIP code 85301 is the most affordable area in Glendale, with a median home value of $310,522 — about $90,000 below the citywide average. Rent in 85301 is also the lowest at $1,166/month, making it the cheapest option whether you’re buying or renting.
Methodology
Home values are based on the Zillow Home Value Index (ZHVI), a smoothed measure of typical home values in the 35th to 65th percentile range. Rent estimates use the Zillow Observed Rent Index (ZORI). Population figures come from the U.S. Census Bureau Population Estimates Program (2020-2024 vintage). All datasets are publicly available. Housing data updated 2026-02-28.