Saint Charles Home Prices: $352K, Up 1.1% — 3 ZIPs Analyzed (2026)
$352K. That’s what a typical home costs in Saint Charles, Missouri — and prices are still climbing, though barely.
The average home price in Saint Charles sits at $351,654 as of February 2026, a 1.1% increase over last year. Not a boom. Not a bust. More like a slow drift upward that has held steady for 12 straight months.
Quick answer: The average home price in Saint Charles, MO is $351,654 as of February 2026, up 1.1% year over year according to Zillow.
Current Home Prices in Saint Charles
Here’s where things stand right now:
| Metric | Value |
|---|---|
| Median Home Price | $351,654 |
| Year-over-Year Change | +1.1% |
| Lowest ZIP Median | $310,281 |
| Highest ZIP Median | $394,658 |
| Number of ZIPs Tracked | 3 |
| Data as of | February 2026 |
The $84,377 gap between the cheapest and most expensive ZIP codes means your neighborhood choice matters. A buyer in the 63301 area pays roughly 78% of what someone in 63304 would spend on a similar home.
That 1.1% annual gain works out to about $3,800 in equity over the past year. It won’t make anyone rich, but it beats a savings account. Compared to markets where prices are dropping 3-5% annually, Saint Charles homeowners are holding value well.
The St. Louis metro area, which includes Saint Charles, has generally avoided the wild swings that hit Sun Belt cities over the past few years. This steady-as-she-goes pattern shows up clearly in the numbers.
Saint Charles Home Prices by Neighborhood
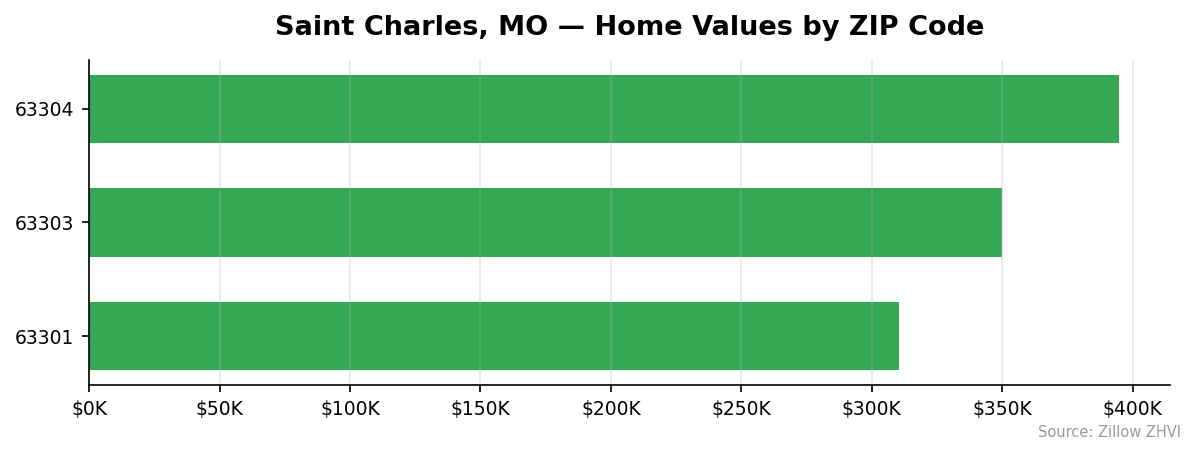
All three tracked ZIP codes in Saint Charles show meaningful price differences:
| ZIP Code | Median Home Value | Avg. Monthly Rent |
|---|---|---|
| 63301 | $310,281 | $1,346 |
| 63303 | $350,024 | $1,417 |
| 63304 | $394,658 | $1,703 |
Most Expensive
63304 tops the list at $394,658 — about 12% above the city-wide average, with rents to match at $1,703/month.
Most Affordable
63301 comes in at $310,281, roughly $41,000 below the city average. Rent here runs just $1,346/month, making it the cheapest option whether you’re buying or renting.
63303 lands right in the middle at $350,024, almost exactly matching the city median. It’s the split-the-difference option — not the cheapest, not the priciest, with rent at $1,417/month.
The price-to-rent relationship stays consistent across all three ZIPs. More expensive areas have proportionally higher rents, which means no single ZIP stands out as a rental bargain relative to home prices.
Rent vs Buy in Saint Charles
Here’s the rent picture across all three ZIP codes:
| ZIP Code | Monthly Rent | Annual Rent |
|---|---|---|
| 63301 | $1,346 | $16,156 |
| 63303 | $1,417 | $17,003 |
| 63304 | $1,703 | $20,433 |
The city-wide average rent comes to roughly $1,489/month.
Now compare that to buying. On a $351,654 home with 20% down ($70,331), you’d finance $281,323. At a 6.5% mortgage rate over 30 years, your principal and interest payment alone would be about $1,779/month. Add property taxes, insurance, and maintenance, and you’re looking at $2,100-$2,300 monthly.
That’s a $600-$800 gap over renting.
Renting is clearly cheaper month-to-month. But buying builds equity. That 1.1% annual appreciation on a $352K home adds roughly $3,800/year in value — money that goes into your pocket, not a landlord’s. Over five years with steady appreciation, you’d build meaningful wealth.
The math favors buying if you plan to stay at least 4-5 years. Shorter than that, renting wins on pure cash flow.
Saint Charles Housing Market Trends
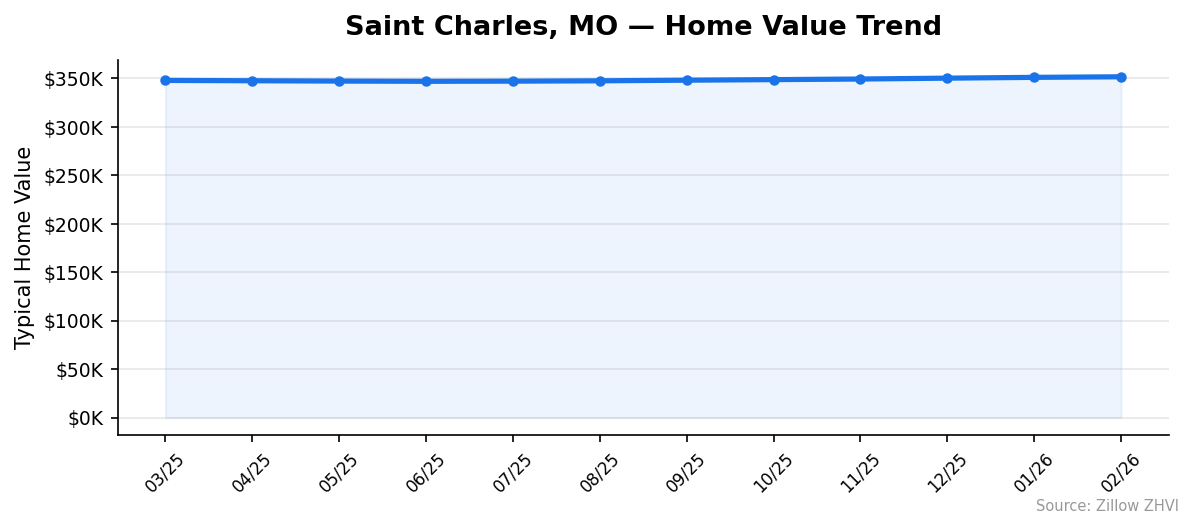
Month-by-month data tells the story of a market on a gentle upward slope:
| Month | Average Price | Low | High |
|---|---|---|---|
| Feb 2026 | $351,654 | $310,281 | $394,658 |
| Jan 2026 | $351,069 | $309,346 | $394,419 |
| Dec 2025 | $350,241 | $308,016 | $394,023 |
| Nov 2025 | $349,353 | $306,606 | $393,545 |
| Oct 2025 | $348,721 | $305,548 | $393,195 |
| Sep 2025 | $348,138 | $304,813 | $392,666 |
| Aug 2025 | $347,508 | $304,083 | $392,152 |
| Jul 2025 | $347,151 | $303,664 | $391,941 |
| Jun 2025 | $347,007 | $303,386 | $391,970 |
| May 2025 | $347,234 | $303,588 | $392,150 |
| Apr 2025 | $347,566 | $303,951 | $392,317 |
| Mar 2025 | $347,915 | $304,402 | $392,429 |
There’s an interesting dip in the middle. Prices actually dropped from March 2025 ($347,915) to a low of $347,007 in June 2025 before climbing again. That mid-year softness lasted only about three months.
Since June 2025, every single month has posted a gain. The pace picked up in the fall — September through February added about $3,500 in value, or roughly $585/month. Not explosive, but consistent.
The cheapest ZIP (63301) gained about $6,900 over the full 12 months while the priciest (63304) gained only $2,200. That means the gap between neighborhoods is narrowing slightly.
Is Saint Charles a Good Place to Buy in 2026?
The data points to a stable market that slightly favors sellers — but only slightly.
Prices are rising, which means buyers face gradually increasing costs. However, 1.1% annual appreciation is barely above inflation. You’re not fighting a runaway market here.
Three factors work in a buyer’s favor. First, prices aren’t volatile. The 12-month range from trough to peak was only about $4,600 on the city average — you won’t overpay by $30K because you bought in the wrong month. Second, the cheapest ZIP (63301) still sits under $315K, keeping entry costs manageable. Third, rents are climbing too, which means waiting doesn’t save you money on either side.
The case against buying: mortgage rates near 6.5% make monthly payments significantly higher than rent. If you’re not sure you’ll stay 4+ years, renting remains the smarter financial play.
For long-term buyers with stable income, Saint Charles offers predictable, low-drama ownership. That’s worth something.
Saint Charles Housing Market Outlook for 2026-2027
The 12-month trend shows a clear pattern: a slight dip in spring/early summer 2025, followed by steady monthly gains from July forward.
If the current pace continues — roughly $500-$600/month in appreciation — expect prices to reach the $355K-$358K range by mid-summer 2026. A run past $360K by year-end is possible but would require the pace to accelerate.
The three-month trend (December through February) averaged about $700/month in gains, slightly faster than the six-month pace. That suggests mild momentum building rather than fading.
No data here points to a correction. The gains are too small and too steady to suggest a bubble. Barring a major economic shock to the St. Louis metro, Saint Charles prices will likely continue grinding higher through 2027, potentially reaching the $365K-$370K range by early 2027.
Similar Markets in MO
If you’re comparing options across Missouri, here are a few markets worth a look:
- Saint Louis — The neighboring city offers a different price profile and urban lifestyle just minutes away.
- Columbia — A college town with its own market dynamics, often more affordable than the St. Louis metro.
- Kansas City — Missouri’s other major metro, with a larger inventory and diverse neighborhoods.
- Lees Summit — A suburban market on the Kansas City side, popular with families.
- Independence — Another KC-area option that typically runs below the metro average.
Frequently Asked Questions
What is the average home price in Saint Charles?
The average home price in Saint Charles, MO is $351,654 as of February 2026. Across the city’s three tracked ZIP codes, prices range from $310,281 in the 63301 area to $394,658 in the 63304 area.
Are home prices going up or down in Saint Charles?
Prices are going up. Saint Charles home values rose 1.1% year over year as of February 2026. The increase has been gradual — about $4,600 over 12 months on the city average. Every month since July 2025 has posted a gain.
Is it cheaper to rent or buy in Saint Charles?
Renting is cheaper on a monthly basis. Average rent across the city runs about $1,489/month. A mortgage payment on the median-priced home (with 20% down at 6.5%) would be roughly $1,779/month before taxes and insurance. However, buying builds equity, and the gap narrows if you factor in appreciation.
What is the most affordable neighborhood in Saint Charles?
ZIP code 63301 is the most affordable area, with a median home value of $310,281 — about $41,000 below the city average. Rent there averages $1,346/month, also the lowest in the city.
Methodology
Home values are based on the Zillow Home Value Index (ZHVI), a smoothed measure of typical home values in the 35th to 65th percentile range. Rent estimates use the Zillow Observed Rent Index (ZORI). Population figures come from the U.S. Census Bureau Population Estimates Program (2020-2024 vintage). All datasets are publicly available. Housing data updated 2026-02-28.