Kansas City Home Prices: $266K, Up 1.1% — 39 ZIPs Analyzed (2026)
$265,914. That’s what a typical Kansas City, MO home was worth at the end of February 2026, according to Zillow’s Home Value Index. Prices rose 1.1% over the prior 12 months — a slow climb that masks wide gaps between neighborhoods.
Quick answer: The average home price in Kansas City, MO is $265,914 as of February 2026, up 1.1% year over year.
Current Home Prices in Kansas City
The city’s housing market sits in the middle of the national pack. Buyers can find homes under $100,000 in a handful of eastern ZIPs and pay more than half a million in pockets near the Country Club Plaza.
| Metric | Value |
|---|---|
| Median home value | $265,914 |
| Year-over-year change | +1.1% |
| Cheapest ZIP | 64120 ($79,507) |
| Most expensive ZIP | 64113 ($561,980) |
| ZIPs tracked | 39 |
| Data through | Feb 28, 2026 |
The spread tells you more than the average. The most expensive ZIP costs roughly 7x the cheapest one. That kind of gap is rare in a midsize Midwest market and reflects the city’s wide geographic footprint — Kansas City covers parts of four counties.
A 1.1% annual gain is mild. For comparison, that’s slower than wage growth and slower than inflation in most months of 2025. If you bought a $266K home a year ago, your equity grew by about $2,800 from price appreciation alone.
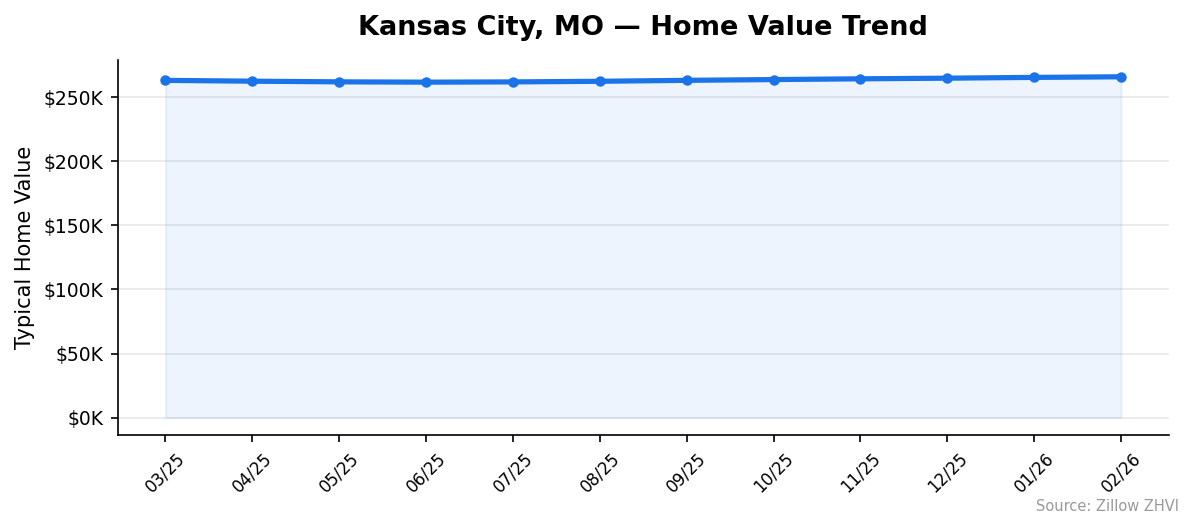
The market has been steady rather than sleepy. Twelve-month trend data shows prices bottomed at $261,722 in June 2025 before climbing back. Every month since June has posted a small gain.
Kansas City Home Prices by Neighborhood
Thirty-nine ZIP codes tell different stories. Here’s every ZIP, sorted high to low.
| ZIP | Median Value | Avg Rent |
|---|---|---|
| 64113 | $561,980 | — |
| 64149 | $499,471 | — |
| 64156 | $453,570 | $2,032 |
| 64165 | $449,051 | — |
| 64139 | $441,632 | — |
| 64154 | $420,305 | $1,538 |
| 64157 | $416,779 | $2,263 |
| 64112 | $408,675 | $1,338 |
| 64145 | $406,089 | — |
| 64158 | $375,493 | $1,569 |
| 64153 | $368,871 | $1,460 |
| 64155 | $343,432 | $1,615 |
| 64151 | $339,806 | $1,584 |
| 64163 | $294,938 | — |
| 64114 | $291,027 | $1,580 |
| 64108 | $288,823 | $1,609 |
| 64146 | $279,611 | — |
| 64111 | $265,177 | $1,269 |
| 64116 | $260,481 | $1,452 |
| 64136 | $258,643 | — |
| 64119 | $252,643 | $1,595 |
| 64131 | $247,023 | $1,282 |
| 64110 | $238,015 | $1,527 |
| 64106 | $219,547 | $2,034 |
| 64137 | $216,462 | $1,424 |
| 64117 | $208,462 | $1,435 |
| 64105 | $192,215 | $1,549 |
| 64109 | $175,050 | $1,169 |
| 64134 | $166,549 | $1,406 |
| 64129 | $148,380 | — |
| 64123 | $122,241 | $1,174 |
| 64124 | $118,839 | $1,108 |
| 64132 | $111,505 | $1,206 |
| 64130 | $101,663 | $1,272 |
| 64128 | $92,520 | $1,098 |
| 64127 | $86,877 | $1,156 |
| 64126 | $86,453 | — |
| 64125 | $82,855 | — |
| 64120 | $79,507 | $1,631 |
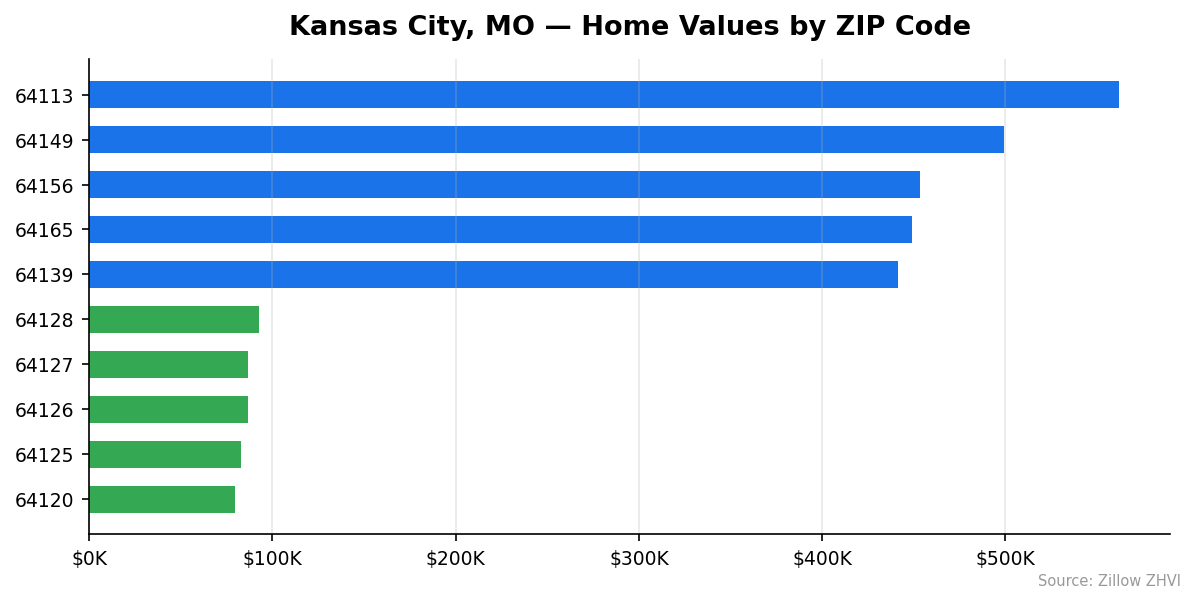
Most Expensive
64113 ($561,980) sits at the top — more than 2x the city median and the only ZIP above $500K. This area covers parts of the Country Club district where larger lots and older homes drive values.
64149 ($499,471) prices at nearly 1.9x the citywide median. It’s a southern ZIP where newer construction skews values higher.
64156 ($453,570) rounds out the top three, with average rent at $2,032 — also among the highest in the city.
Most Affordable
64120 ($79,507) holds the floor at less than a third of the city median. Despite the low price, rent here averages $1,631 — meaning rental yields look strong for investors.
64125 ($82,855) comes in just above 64120, at roughly 31% of the city average.
64126 ($86,453) lands at the third-cheapest spot. All three of these eastern ZIPs price well below $100K — a tier you won’t find in most U.S. metros of this size.
Rent vs Buy in Kansas City
Average rent across the 28 ZIPs with rent data sits at roughly $1,478 per month. That’s a useful baseline.
Now the buy side. A $265,914 home with 20% down ($53,183) leaves a $212,731 mortgage. At a 7% rate on a 30-year fixed, the monthly principal and interest works out to about $1,415. Add property taxes (roughly $330 monthly at Missouri’s effective rate) and homeowner’s insurance (around $100), and the all-in payment runs close to $1,847.
| Cost | Monthly |
|---|---|
| Average rent | $1,478 |
| Mortgage P&I | $1,415 |
| Taxes + insurance | $430 |
| Total to buy | $1,847 |
The math tilts toward renting in 2026. You’d save about $370 per month renting at the average rate versus buying the average home with 20% down. That gap shrinks if you put more down, hold longer, or buy below the median price.
Rent varies sharply by neighborhood. ZIP 64157 commands $2,263 — higher than the citywide buy payment. ZIP 64128 rents for $1,098, well below the buy break-even. If you can rent in a cheap ZIP and buy in a different one later, the gap widens further.
Population Growth and Migration
Kansas City keeps adding residents, though slowly. The city counted 516,032 people in 2024, up from 508,096 in 2020 — a 1.6% gain over four years.
| Year | Population |
|---|---|
| 2020 | 508,096 |
| 2021 | 508,995 |
| 2022 | 508,913 |
| 2023 | 511,300 |
| 2024 | 516,032 |
Growth has accelerated. The city barely moved between 2020 and 2022, then added nearly 5,000 residents in 2024 alone. That uptick aligns with the housing market’s recovery off the June 2025 low.
The surrounding suburbs are growing faster.
| City | 2024 Population | 4-Yr Growth |
|---|---|---|
| St. Peters | 61,398 | +6.4% |
| Lee’s Summit | 106,419 | +4.8% |
| O’Fallon | 95,355 | +4.0% |
| Blue Springs | 61,246 | +4.0% |
| Columbia | 130,900 | +3.6% |
| Kansas City | 516,032 | +1.6% |
What this means for housing: demand is steady but not surging. The slow 1.1% price gain matches the slow population growth. Buyers don’t face the bidding wars seen in faster-growing Sun Belt cities, and inventory isn’t getting absorbed at panic speed.
Kansas City Housing Market Trends
The 12-month trend shows a market that dipped and recovered.
| Month | Median |
|---|---|
| Feb 2026 | $265,914 |
| Jan 2026 | $265,439 |
| Dec 2025 | $264,829 |
| Nov 2025 | $264,341 |
| Oct 2025 | $263,747 |
| Sep 2025 | $263,151 |
| Aug 2025 | $262,405 |
| Jul 2025 | $261,923 |
| Jun 2025 | $261,722 |
| May 2025 | $261,972 |
| Apr 2025 | $262,475 |
| Mar 2025 | $263,123 |
Prices fell from $263,123 in March 2025 to a low of $261,722 in June — a drop of $1,401 or 0.5%. Since then, the market has gained ground every month, adding $4,192 over eight months.
The recovery has held steady. Recent monthly gains have averaged about $500. That’s a measured pace — not a boom, not a bust.
Is Kansas City a Good Place to Buy in 2026?
The data points to a balanced market with a slight buyer’s edge. Here’s why.
Price growth is modest. A 1.1% annual gain barely keeps up with inflation. You’re not buying into a market that’s pricing you out month by month — but you’re also not getting big appreciation.
Renting is cheaper short-term. The $370 monthly gap favors renters who plan to stay under five years. Beyond that, equity build-up and tax benefits start tipping the scales.
The affordability spread is huge. You can buy a house under $90,000 in five different ZIPs. That’s nearly impossible in coastal markets.
Population growth is slow. Demand isn’t pushing prices hard. If you’re patient, you can negotiate. If you’re a seller, expect deals to take time.
Kansas City Housing Market Outlook for 2026-2027
The 3-month trend suggests continued mild gains. Prices added $475 in February, $610 in January, and $488 in December — an average of about $524 per month.
If that pace continues through summer 2026, the median would approach $268,000 to $269,000 by August. That’s roughly 2% above current levels.
The risk to this forecast is rate sensitivity. The market dipped through spring 2025 when mortgage rates pushed higher. Any rate spike in 2026 could pause the recovery. Conversely, falling rates would likely accelerate gains.
Watch the cheaper ZIPs. The data shows the minimum ZIP value climbing fastest in percentage terms — from $72,040 in March 2025 to $79,507 in February 2026. That’s a 10% gain in 11 months. If that pattern holds, the affordability gap between neighborhoods will narrow.
Similar Markets in MO
- Saint Louis — Missouri’s other major metro for buyers comparing urban markets.
- Lees Summit — A fast-growing Kansas City suburb that adds 4.8% population every four years.
- Independence — A neighboring city often considered by buyers priced out of Kansas City proper.
- Springfield — A smaller, cheaper Missouri market further south.
- Columbia — A growing college town that’s gained 3.6% in four years.
Frequently Asked Questions
What is the average home price in Kansas City?
The average home price in Kansas City, MO is $265,914 as of February 2026. That figure represents the typical home value across 39 ZIP codes, ranging from $79,507 to $561,980.
Are home prices going up or down in Kansas City?
Prices are rising slowly. The market is up 1.1% year over year, adding roughly $2,791 to the typical home value. Recent monthly gains have averaged about $500 since the market bottomed in June 2025.
Is it cheaper to rent or buy in Kansas City?
Renting saves about $370 per month at average prices. The average rent across tracked ZIPs is $1,478, while a mortgage on the median $265,914 home with 20% down runs roughly $1,847 including taxes and insurance.
What is the most affordable neighborhood in Kansas City?
ZIP 64120 is the cheapest at $79,507 — less than a third of the citywide median. ZIPs 64125 ($82,855) and 64126 ($86,453) follow as the second and third most affordable areas tracked.
Methodology
Home values are based on the Zillow Home Value Index (ZHVI), a smoothed measure of typical home values in the 35th to 65th percentile range. Rent estimates use the Zillow Observed Rent Index (ZORI). Population figures come from the U.S. Census Bureau Population Estimates Program (2020-2024 vintage). All datasets are publicly available. Housing data updated 2026-02-28.