Poplar Bluff Home Prices: $182K, Up 5.6% — 4 ZIPs Analyzed (2026)
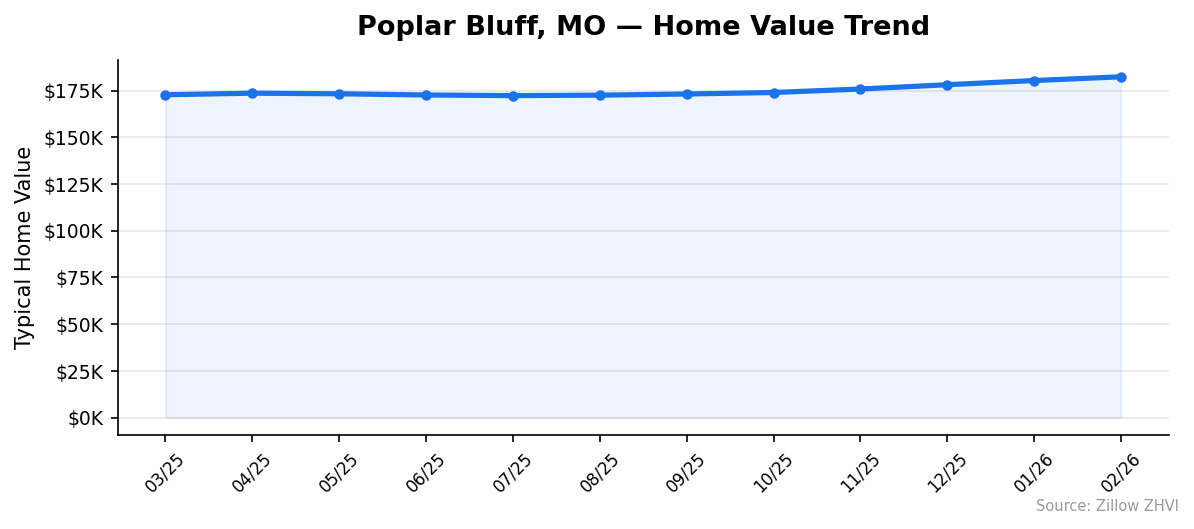
$182,371. That is what a typical home in Poplar Bluff costs as of February 2026, and the number is climbing. Values are up 5.6% from a year ago, with most of that gain stacking up since late fall.
Quick answer: The average home price in Poplar Bluff, MO is $182,371 as of February 2026, up 5.6% year over year according to Zillow.
Current Home Prices in Poplar Bluff
The Poplar Bluff market sits well below the U.S. median. You are paying roughly half of what the typical American home buyer pays right now. The city’s 4-ZIP footprint shows a tight spread, but there is still about $36,000 between the cheapest and priciest neighborhood.
| Metric | Value |
|---|---|
| Average home price | $182,371 |
| YoY change | +5.6% |
| Lowest ZIP value | $166,257 |
| Highest ZIP value | $202,248 |
| Spread (high − low) | $35,991 |
| ZIP codes tracked | 4 |
| Data through | February 2026 |
The 5.6% annual gain is faster than the national rate. That matters for two reasons. First, buyers waiting for a better deal have not been rewarded — prices were $172,758 in March 2025 and have only moved up since then. Second, the gain is not coming from a single hot ZIP. All four ZIPs have lifted together over the past 12 months, which suggests the move is broad rather than driven by one luxury pocket.
The price floor of $166,257 means even the cheapest typical home in town is still well above what cash buyers in rural Missouri were paying a few years ago. The ceiling at $202,248 is the kind of number that buys a much smaller property in St. Louis or Kansas City.
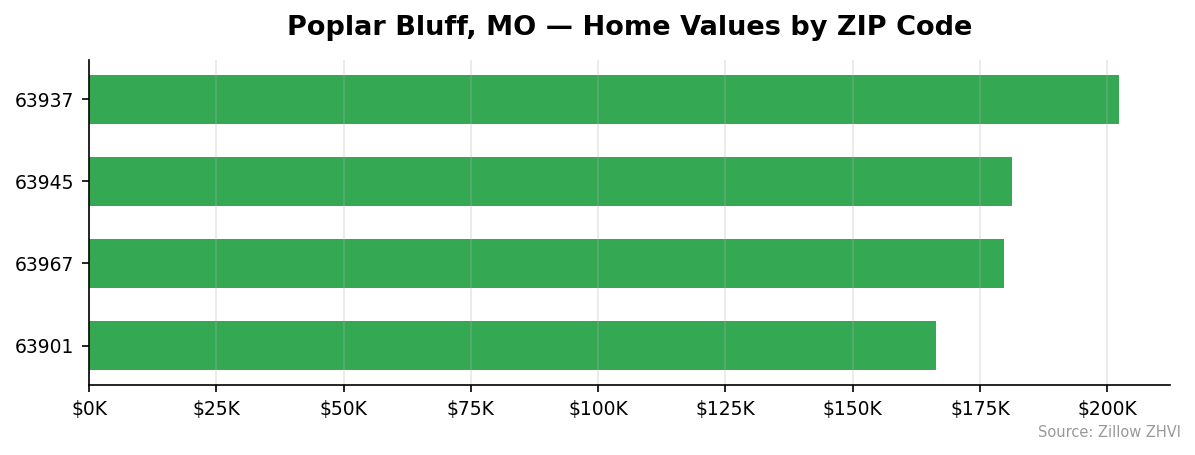
Poplar Bluff Home Prices by Neighborhood
| ZIP | Typical Value | vs City Avg |
|---|---|---|
| 63937 | $202,248 | +10.9% |
| 63945 | $181,271 | -0.6% |
| 63967 | $179,709 | -1.5% |
| 63901 | $166,257 | -8.8% |
Most Expensive
- 63937 — $202,248. The clear top of the market and the only ZIP above $200K. It runs about $20,000 above the city average.
- 63945 — $181,271. Sits almost exactly on the city average, so it sets the baseline more than the ceiling.
- 63967 — $179,709. Less than $1,600 below 63945, making the middle of the Poplar Bluff market a tight cluster.
Most Affordable
- 63901 — $166,257. The cheapest ZIP, about 8.8% below the city average. It is also the only ZIP with published rent data, at $1,300 a month.
- 63967 — $179,709. The next step up. You pay roughly $13,500 more than 63901 for the typical home.
- 63945 — $181,271. Effectively tied with 63967 and still under the city average.
Rent vs Buy in Poplar Bluff
Rent data is published for ZIP 63901 only, where the typical asking rent is $1,300 a month. Use that as your benchmark for the lower end of the city.
Run the buy-side math against the $182,371 city median. A 20% down payment is $36,474, leaving a $145,897 loan. At a 7% 30-year fixed rate, principal and interest come to roughly $970 a month. Add property taxes (Missouri averages around 1% of value, or about $150 a month) and homeowner’s insurance (around $100 a month for a home this size). Total monthly carrying cost lands near $1,220 before maintenance.
That puts buying within $80 a month of renting in 63901, on a strict payment basis. The catch is the down payment. You need over $36,000 in cash to enter the buy side at the city median. A 5% down FHA loan changes the picture: the lower upfront cost ($9,119) pushes the monthly payment up because of the larger loan and mortgage insurance, often into the $1,400-$1,500 range.
For a buyer planning to stay 5 or more years, the math points to buying. For a 1-2 year stay, renting at $1,300 in 63901 saves you closing costs and the risk of a flat-to-negative resale.
Population Growth and Migration
Poplar Bluff is losing people, slowly. The population dropped from 16,283 in 2020 to 16,177 in 2024 — a 0.7% decline over four years. The city briefly grew to 16,320 in 2021 before each subsequent year shed residents.
| Year | Population |
|---|---|
| 2020 | 16,283 |
| 2021 | 16,320 |
| 2022 | 16,303 |
| 2023 | 16,203 |
| 2024 | 16,177 |
Compare that to the bigger growth markets in Missouri:
| City | 2024 Population | 4-Yr Growth |
|---|---|---|
| St. Peters | 61,398 | +6.4% |
| Lee’s Summit | 106,419 | +4.8% |
| O’Fallon | 95,355 | +4.0% |
| Columbia | 130,900 | +3.6% |
| St. Charles | 72,458 | +2.4% |
| Poplar Bluff | 16,177 | -0.7% |
That is unusual context for a market with prices up 5.6%. Demand is not coming from in-migration. The price gains are running on tight inventory, low supply of new construction in rural Butler County, and buyers refinancing into Poplar Bluff from higher-cost Missouri metros. If you are buying here as an investor, do not underwrite rent or appreciation against population growth — there is none.
Poplar Bluff Housing Market Trends
| Month | Avg Value | Min | Max |
|---|---|---|---|
| Feb 2026 | $182,371 | $166,257 | $202,248 |
| Jan 2026 | $180,361 | $163,870 | $200,237 |
| Dec 2025 | $178,132 | $161,346 | $198,712 |
| Nov 2025 | $175,829 | $159,064 | $197,689 |
| Oct 2025 | $173,960 | $157,595 | $196,677 |
| Sep 2025 | $173,166 | $156,883 | $196,830 |
| Aug 2025 | $172,549 | $156,245 | $196,677 |
| Jul 2025 | $172,292 | $155,731 | $197,142 |
| Jun 2025 | $172,642 | $155,612 | $198,651 |
| May 2025 | $173,275 | $155,817 | $200,541 |
| Apr 2025 | $173,595 | $156,012 | $201,645 |
| Mar 2025 | $172,758 | $155,753 | $200,371 |
The market spent spring and summer 2025 effectively flat — values bounced between $172K and $173K from June through September. The break came in October, and the move has been consistent since: $173,960 → $175,829 → $178,132 → $180,361 → $182,371. That is a $8,400 lift in four months, or about $2,100 a month.
The minimum value (the bottom ZIP) is up nearly $11,000 since July 2025, while the top ZIP has only added about $5,000. The gap between cheap and expensive Poplar Bluff is closing.
Is Poplar Bluff a Good Place to Buy in 2026?
The data points to a seller’s market. Prices are rising, the slope is accelerating, and the cheaper ZIPs are catching up to the expensive one — both signs of a market with more buyers than supply.
For buyers, that means the longer you wait, the more you pay. A home that was $173,000 in July is $182,000 today. If you are budget-conscious, ZIP 63901 still offers the best entry point at $166,257 and is the only ZIP with the rent option as backup.
For sellers, the price-rise data favors listing now while momentum is on your side. The risk: Poplar Bluff’s population is slowly shrinking, and the current price strength rests on tight inventory rather than new demand. That floor can shift quickly if a few sellers decide to test the market at once.
The flat 12-month period from spring to fall 2025 is a useful warning. Markets like Poplar Bluff can trade sideways for two quarters before resuming. Do not assume the current 5.6% YoY pace is permanent.
Poplar Bluff Housing Market Outlook for 2026-2027
The 3-month trend suggests prices will keep climbing into the summer. Values added roughly $2,100 per month from November through February, and there is no break in that pattern in the most recent data point.
If the current pace continues, you would see Poplar Bluff cross $185,000 in the spring buying season. Whether the pace holds is the harder question. The May-through-September 2025 period showed prices can stall here for months, and Poplar Bluff lacks the in-migration that keeps a market trending in one direction for long.
A reasonable read: expect the upward move to slow rather than reverse. The combination of low supply, no population growth, and a rising minimum value all argue for a market that grinds higher at a slower rate, not one that breaks back down. Watch the bottom ZIP — when 63901 stops gaining, the rest of the city usually follows within two months.
Similar Markets in MO
- Columbia — A college town with population growth Poplar Bluff lacks, and prices to match.
- Springfield — The closest mid-size Missouri market for buyers who want more inventory than Poplar Bluff offers.
- Jefferson City — State capital with a similarly stable, slow-moving housing market.
- Saint Louis — A large urban market with a wider price range and more ZIP variation than Poplar Bluff’s 4-ZIP footprint.
- Kansas City — The other major Missouri metro, useful as a benchmark for what Poplar Bluff buyers give up in amenities and gain in price.
Frequently Asked Questions
What is the average home price in Poplar Bluff?
The average home price in Poplar Bluff, MO is $182,371 as of February 2026. That number averages the typical home value across the city’s 4 ZIP codes, which range from $166,257 in 63901 to $202,248 in 63937.
Are home prices going up or down in Poplar Bluff?
Up. Values are 5.6% higher than a year ago and have gained about $8,400 in the past four months alone. The market traded sideways through summer 2025 before breaking higher in October.
Is it cheaper to rent or buy in Poplar Bluff?
The two options are roughly even on monthly cost. Rent in ZIP 63901 runs $1,300 a month, while a mortgage on the $182,371 city median (20% down, 7% rate) plus taxes and insurance lands near $1,220 a month. Buying wins for stays of 5+ years; renting wins for short stays because of closing costs.
What is the most affordable neighborhood in Poplar Bluff?
ZIP 63901 is the cheapest at $166,257, about 8.8% below the city average. It is also the only ZIP in town with published rent data, making it the best fit for buyers who want a fallback rental option.
Methodology
Home values are based on the Zillow Home Value Index (ZHVI), a smoothed measure of typical home values in the 35th to 65th percentile range. Rent estimates use the Zillow Observed Rent Index (ZORI). Population figures come from the U.S. Census Bureau Population Estimates Program (2020-2024 vintage). All datasets are publicly available. Housing data updated 2026-02-28.