Indianapolis Home Prices: $248K, Up 0.3% — 33 ZIPs Analyzed (2026)
$248,344. That’s what a typical home costs in Indianapolis right now — and it’s barely moved in a year. While other Midwest metros have seen sharper swings, Indy has stayed remarkably flat, ticking up just 0.3% year over year. With 33 ZIP codes spanning a $308,000 gap between the cheapest and priciest neighborhoods, the real story is where you buy, not when.
Quick answer: The average home price in Indianapolis, IN is $248,344 as of February 2026, up 0.3% year over year according to Zillow.
Current Home Prices in Indianapolis
Indianapolis remains one of the more affordable major cities in the Midwest. Here’s the snapshot as of February 2026:
| Metric | Value |
|---|---|
| Median Home Value | $248,344 |
| Year-over-Year Change | +0.3% |
| Lowest ZIP Code Value | $113,174 |
| Highest ZIP Code Value | $421,132 |
| Number of ZIP Codes Tracked | 33 |
That 0.3% annual gain works out to roughly $745 in added home value over the past 12 months. Not exactly a windfall for sellers, but not a loss either. The spread between the cheapest and most expensive neighborhoods is $307,958 — meaning you can buy a home in one part of Indianapolis for what amounts to a down payment in another.
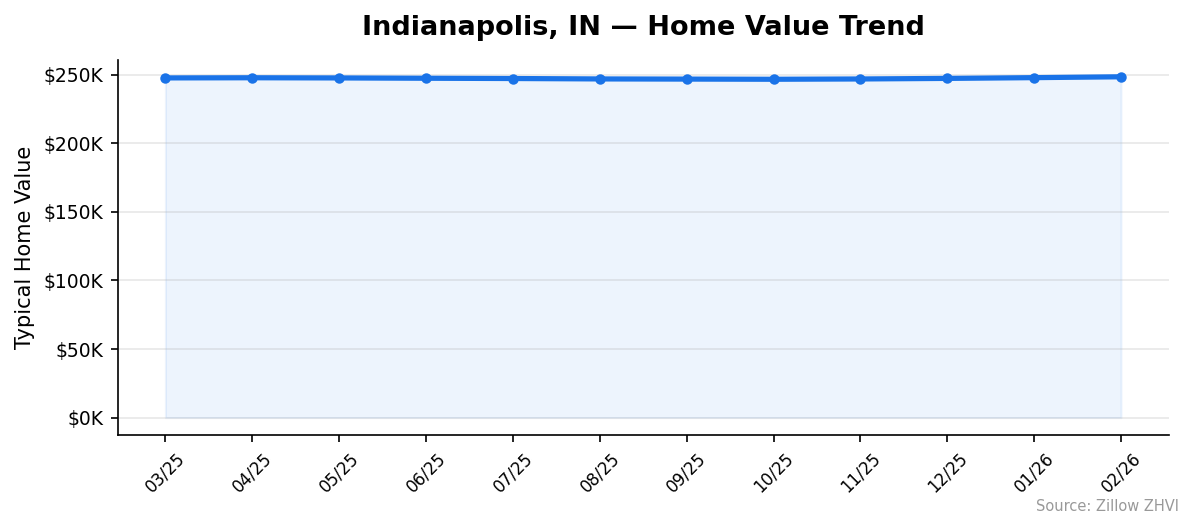
The February 2026 median of $248,344 is up slightly from $247,720 in January and $247,169 in December. Month-to-month gains have been modest but consistent through the winter, a period when prices typically flatten or dip. That slow grind upward suggests steady demand even during the off-season.
For context, the metro-area designation is Indianapolis-Carmel-Anderson, IN, which includes higher-priced suburbs like Carmel and Fishers. The city-proper numbers here reflect Indianapolis itself.
Indianapolis Home Prices by Neighborhood
Prices vary sharply across Indianapolis. Here are all 33 tracked ZIP codes ranked from most to least expensive:
| ZIP Code | Median Home Value | Typical Rent |
|---|---|---|
| 46278 | $421,132 | N/A |
| 46259 | $366,380 | N/A |
| 46240 | $357,474 | $1,566 |
| 46202 | $345,055 | $1,421 |
| 46204 | $339,530 | $1,572 |
| 46256 | $338,639 | $1,284 |
| 46220 | $334,251 | $1,517 |
| 46250 | $320,058 | $1,375 |
| 46260 | $299,216 | $1,212 |
| 46239 | $290,210 | $1,908 |
| 46234 | $275,936 | $2,086 |
| 46113 | $275,117 | $1,870 |
| 46228 | $264,423 | $1,585 |
| 46237 | $256,922 | $1,778 |
| 46231 | $255,353 | $2,049 |
| 46217 | $255,136 | $1,644 |
| 46205 | $249,861 | $1,225 |
| 46268 | $248,739 | $1,453 |
| 46214 | $227,251 | $1,243 |
| 46227 | $224,631 | $1,307 |
| 46254 | $217,495 | $1,269 |
| 46235 | $215,361 | $1,582 |
| 46229 | $215,134 | $1,607 |
| 46221 | $207,879 | $1,558 |
| 46219 | $183,816 | $1,071 |
| 46208 | $175,206 | $1,406 |
| 46225 | $168,202 | $1,457 |
| 46203 | $164,129 | $1,436 |
| 46226 | $159,346 | $1,153 |
| 46241 | $154,122 | $1,311 |
| 46201 | $148,358 | $1,165 |
| 46222 | $127,811 | $1,101 |
| 46218 | $113,174 | $1,073 |
Most Expensive Neighborhoods
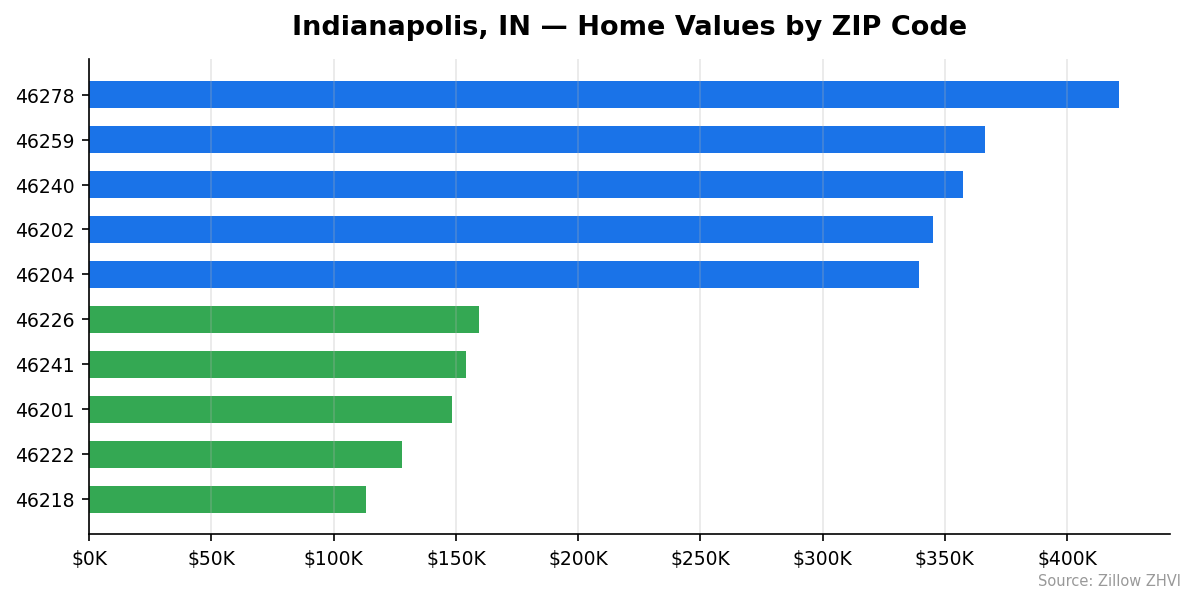
46278 leads at $421,132 — nearly 70% above the city median — covering the far northwest side near Eagle Creek, an area with newer construction and larger lots. 46259 follows at $366,380 with no rent data available, reflecting a lower-density residential area on the southeast fringe. 46240 comes in at $357,474 with typical rents of $1,566, located in the North Central corridor near Broad Ripple and the Monon Trail.
Most Affordable Neighborhoods
46218 is the cheapest at $113,174, less than half the citywide median, with rents at just $1,073. 46222 sits at $127,811 with $1,101 rents — located on the near west side. 46201 rounds out the bottom three at $148,358, an east-side ZIP where rents average $1,165.
Rent vs Buy in Indianapolis
Rent data is available for 31 of 33 tracked ZIP codes. Here’s how the numbers break down.
The cheapest rents are in 46219 at $1,071/month and 46218 at $1,073/month — both areas where home values also sit well below the city median. The most expensive rents are in 46234 at $2,086/month and 46231 at $2,049/month.
For a rough mortgage estimate on the median-priced home ($248,344): put 20% down ($49,669), finance $198,675 at a 7% rate for 30 years, and you’re looking at roughly $1,322/month in principal and interest alone. Add property taxes, insurance, and maintenance, and the total monthly cost runs closer to $1,700-$1,800.
Compare that to a typical rent in the $1,300-$1,500 range across most ZIP codes. Renting is cheaper on a monthly basis in the majority of Indianapolis neighborhoods.
But the math shifts in the affordable ZIPs. In 46218, a 20% down purchase puts your mortgage payment around $602/month before taxes and insurance. Combined costs might land near $900-$1,000 — potentially less than the $1,073 rent for the same area. In the cheapest parts of Indianapolis, buying can actually undercut renting.
The flip side: in the priciest ZIPs, renting saves you $500+ per month compared to a mortgage. 46278 homes at $421K mean roughly $2,240/month in principal and interest — far above the citywide rent average.
Indianapolis Housing Market Trends
Here’s how the citywide median has moved over the past 12 months:
| Month | Median Value | Low | High |
|---|---|---|---|
| Feb 2026 | $248,344 | $113,174 | $421,132 |
| Jan 2026 | $247,720 | $113,486 | $419,863 |
| Dec 2025 | $247,169 | $113,803 | $418,131 |
| Nov 2025 | $246,762 | $113,648 | $416,078 |
| Oct 2025 | $246,544 | $113,201 | $413,948 |
| Sep 2025 | $246,670 | $112,757 | $412,493 |
| Aug 2025 | $246,782 | $112,467 | $411,081 |
| Jul 2025 | $247,086 | $112,736 | $410,245 |
| Jun 2025 | $247,282 | $113,536 | $409,048 |
| May 2025 | $247,509 | $114,689 | $408,593 |
| Apr 2025 | $247,635 | $115,761 | $408,041 |
| Mar 2025 | $247,525 | $116,257 | $407,398 |
The story in the median column is flat — a $1,800 total range across 12 months. Prices dipped slightly from spring 2025 into fall, hitting a low of $246,544 in October, then recovered through the winter. The total swing from October’s low to February’s high is just $1,800, or 0.7%.
What’s more interesting is the high end. The most expensive ZIP climbed from $407,398 in March 2025 to $421,132 in February 2026 — a $13,734 gain. Meanwhile, the cheapest ZIP actually fell from $116,257 to $113,174 over the same period. The gap between rich and poor neighborhoods widened by roughly $17,000 in one year.
Is Indianapolis a Good Place to Buy in 2026?
The data points to a balanced market. A 0.3% annual gain is essentially flat — neither sellers nor buyers have a clear upper hand.
For buyers, the case is straightforward: prices aren’t running away from you. You have time to shop. The monthly trend shows no sudden acceleration, and with 33 ZIP codes tracked, you have options ranging from $113K starter homes to $421K premium properties.
For sellers, there’s no urgency to list before a crash. Prices haven’t declined year over year. But don’t expect bidding wars either — the kind of 0.3% annual appreciation barely keeps pace with inflation.
The rent-vs-buy math favors purchasing in the lower-priced neighborhoods, especially if you plan to stay 5+ years. In the higher-priced ZIPs, the monthly cost gap makes renting more attractive in the short term.
Indianapolis remains well below the national median home price, which gives it a built-in appeal for buyers relocating from costlier markets on the coasts. A $248K median means a 20% down payment is under $50,000 — within reach for many dual-income households.
Indianapolis Housing Market Outlook for 2026-2027
The 3-month trend from December through February shows a gentle upward drift: $247,169 to $248,344. If that pace continues, you’d be looking at a median around $252,000-$254,000 by the end of 2026 — a gain of roughly 2%.
But this market has shown a seasonal pattern. Prices edged down from their spring 2025 level into the fall, then rebounded through winter. If the same cycle repeats, expect a slight bump in spring and summer followed by a plateau or minor pullback in the fall months.
The widening gap between top and bottom ZIP codes suggests that higher-end neighborhoods are attracting more demand, while the most affordable areas are softening. Buyers eyeing sub-$150K homes should watch whether that downward trend in the floor price continues.
Nothing in the data points to a sharp move in either direction. Indianapolis looks set for another year of single-digit changes.
Similar Markets in IN
If you’re considering Indianapolis, these Indiana cities are worth a look:
- Carmel — Just north of Indianapolis in Hamilton County, Carmel typically commands higher prices and is a popular suburb for families.
- Fishers — Another Hamilton County suburb northeast of Indy, Fishers has seen strong growth and newer housing stock.
- Fort Wayne — Indiana’s second-largest city offers significantly lower home prices for buyers willing to move two hours northeast.
- Bloomington — Home to Indiana University, Bloomington’s market is shaped by student rental demand and a smaller inventory.
- Evansville — In the state’s southwestern corner, Evansville is one of Indiana’s most affordable mid-size cities.
Frequently Asked Questions
What is the average home price in Indianapolis?
The average home price in Indianapolis is $248,344 as of February 2026. That figure represents the citywide median across 33 tracked ZIP codes, with individual neighborhoods ranging from $113,174 in 46218 to $421,132 in 46278.
Are home prices going up or down in Indianapolis?
Prices are up 0.3% year over year — essentially flat. The monthly trend shows a slight dip from spring 2025 into October, followed by a steady recovery through winter. No sharp moves in either direction.
Is it cheaper to rent or buy in Indianapolis?
In most neighborhoods, renting is cheaper month-to-month. Typical rents run $1,300-$1,500 while a mortgage on the median home costs roughly $1,700-$1,800 including taxes and insurance. However, in the most affordable ZIPs like 46218, buying can cost less per month than renting.
What is the most affordable neighborhood in Indianapolis?
ZIP code 46218 has the lowest typical home value at $113,174, with rents around $1,073/month. ZIP 46222 ($127,811) and 46201 ($148,358) are the next most affordable options.
Methodology
Home values are based on the Zillow Home Value Index (ZHVI), a smoothed measure of typical home values in the 35th to 65th percentile range. Rent estimates use the Zillow Observed Rent Index (ZORI). Population figures come from the U.S. Census Bureau Population Estimates Program (2020-2024 vintage). All datasets are publicly available. Housing data updated 2026-02-28.