Johnson City Home Prices: $290K, Down 0.6% — 3 ZIPs Analyzed (2026)
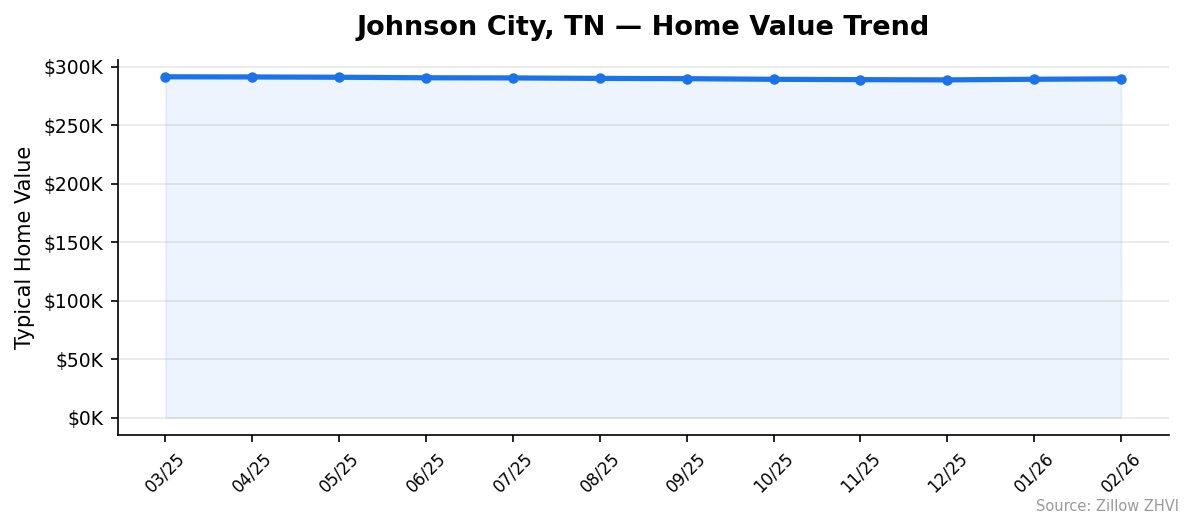
$289,608. That’s the typical home price in Johnson City, TN as of February 2026. Prices are down 0.6% over the past year, with the market peaking in March 2025 before easing back.
Quick answer: The average home price in Johnson City, TN is $289,608 as of February 2026, down 0.6% year over year according to Zillow.
Current Home Prices in Johnson City
The Johnson City housing market sits well below the U.S. median. Here’s what the numbers look like right now.
| Metric | Value |
|---|---|
| Median home price | $289,608 |
| Year-over-year change | -0.6% |
| Cheapest ZIP | $255,616 (37601) |
| Most expensive ZIP | $341,551 (37615) |
| ZIP codes tracked | 3 |
| Data through | February 2026 |
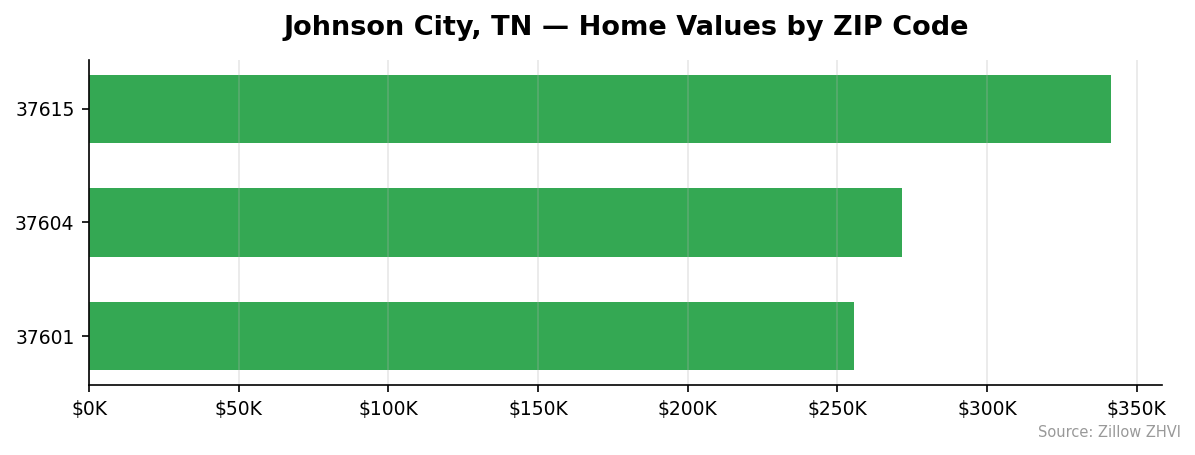
The spread between the cheapest and most expensive ZIP is about $86,000 — a 34% gap. That matters if you’re shopping. The same buyer budget gets very different homes depending on which side of the city you target.
The 0.6% annual decline is small. Treat Johnson City as flat, not falling. A year ago in February 2025, prices were tracking near $291,000. They’ve eased slightly since.
For context, the metro area’s pricing is concentrated. With only three ZIP codes carrying meaningful sales activity, the median moves on a thinner sample than larger markets. Don’t over-read month-to-month wiggles.
Johnson City Home Prices by Neighborhood
Here’s how the three ZIPs stack up.
| ZIP Code | Median Home Value | Avg Rent |
|---|---|---|
| 37615 | $341,551 | $1,590 |
| 37604 | $271,658 | $1,366 |
| 37601 | $255,616 | $1,271 |
Most Expensive
- 37615 — $341,551. This ZIP runs about 18% above the city average and commands the highest rents at $1,590. It’s the premium tier of the local market.
- 37604 — $271,658. A middle-ground option, sitting roughly 6% below the city average with rents at $1,366.
- 37601 — $255,616. The most affordable of the three, but still represents a sizable share of the city’s housing stock.
Most Affordable
- 37601 — $255,616. The cheapest entry point in Johnson City — about 12% below the city average — with the lowest rent at $1,271.
- 37604 — $271,658. A step up from 37601 but still under the city median. Rents around $1,366.
- 37615 — $341,551. The high end. If you want budget options, this isn’t where to look.
With only three ZIPs in the dataset, every neighborhood matters. There’s no “in between” — you’re either in the affordable tier or the premium one.
Rent vs Buy in Johnson City
Rents in Johnson City average about $1,409 across the three ZIPs ($1,271, $1,366, and $1,590).
A buyer purchasing the median $289,608 home with 20% down ($57,922) would borrow $231,686. At a 7% rate on a 30-year fixed, monthly principal and interest comes to roughly $1,541. Add property tax and insurance — call it another $350 — and you’re at about $1,890 a month.
That’s a $480 monthly gap between renting and owning at the median.
| Scenario | Monthly Cost |
|---|---|
| Rent (city average) | $1,409 |
| Buy (median home, 20% down) | ~$1,890 |
| Difference | ~$481 |
Renting is cheaper now. But the buy number includes building equity. A renter pays $1,409 and walks away with nothing. A buyer pays more, but several hundred dollars of that goes toward principal.
The break-even depends on how long you stay. In a market that’s been flat to slightly down, banking on appreciation is a weak bet. Run the math on your specific situation before assuming buying wins.
In ZIP 37601, the gap narrows. Buying a $255,616 home with 20% down lands closer to $1,670 a month — a $399 premium over the $1,271 rent there. In 37615, the spread is wider.
Population Growth and Migration
Johnson City is growing, but slowly compared to other Tennessee markets.
| Year | Population |
|---|---|
| 2020 | 71,121 |
| 2021 | 71,145 |
| 2022 | 72,616 |
| 2023 | 73,447 |
| 2024 | 73,635 |
That’s a 3.5% gain over four years — about 2,500 new residents.
Compare that to the rest of the state.
| City | 2024 Population | 4-Year Growth |
|---|---|---|
| Smyrna | 60,302 | 12.7% |
| Clarksville | 185,690 | 10.8% |
| Murfreesboro | 168,387 | 9.5% |
| Franklin | 89,142 | 5.9% |
| Chattanooga | 191,496 | 5.1% |
| Johnson City | 73,635 | 3.5% |
Johnson City trails every comparison city. The Nashville metro and its suburbs are pulling in new residents three to four times faster.
That has direct housing implications. Slower population growth means less pressure on prices. It helps explain why Johnson City’s market is flat while Smyrna and Clarksville push higher. You aren’t competing with a flood of new arrivals here.
Johnson City Housing Market Trends
Here’s the 12-month price path.
| Month | Median Value |
|---|---|
| March 2025 | $291,361 |
| April 2025 | $291,208 |
| May 2025 | $290,980 |
| June 2025 | $290,517 |
| July 2025 | $290,379 |
| August 2025 | $289,993 |
| September 2025 | $289,747 |
| October 2025 | $289,209 |
| November 2025 | $288,909 |
| December 2025 | $288,724 |
| January 2026 | $289,246 |
| February 2026 | $289,608 |
Prices peaked in March 2025 and slid steadily through December — a $2,637 drop over nine months. Then they reversed. January and February ticked higher.
The total swing from peak to current is just $1,753, or 0.6%. That’s well within the noise band of a smoothed index. Calling Johnson City a falling market overstates it. It’s flat.
The two-month rebound is the most interesting signal. After consistent monthly declines, the line turned. Whether that’s the start of a recovery or a blip depends on the next few prints.
Is Johnson City a Good Place to Buy in 2026?
The data points to a balanced or mildly buyer-friendly market.
Prices are flat. Sellers don’t have much room to push. The 0.6% annual decline tells you negotiation space exists at the listing-price level. Population growth is slow at 3.5% over four years, so you aren’t bidding against a wave of relocations.
For buyers with a long horizon, flat is fine. You’re not paying a top-of-market premium. The cheapest ZIP at $255,616 is genuinely affordable by national standards.
For investors, the rent-to-price math is okay but not great. ZIP 37615 generates $1,590 in rent against a $341,551 home — that’s a 5.6% gross yield. Cheaper ZIPs do better: 37601 produces a 6.0% gross yield.
Sellers face a tougher pitch. Two years of flat-to-down prices means you may need to wait or price aggressively to move inventory.
Johnson City Housing Market Outlook for 2026-2027
The 3-month trend suggests the price decline has stalled. After nine straight months of declines through December 2025, January and February 2026 both posted small gains. That’s the first two-month back-to-back uptick in the data.
If the current pace continues, Johnson City prices likely drift sideways through mid-2026 with a slight upward bias. The total range over the past year is about $2,600 — meaning even the largest moves have been small in dollar terms.
Population growth is positive but modest. With the metro adding roughly 600 residents per year on average, demand pressure stays low. That argues against any sharp price spike.
The honest call: expect flat prices in the $285,000 to $295,000 range over the next 6 months, with most of the action coming from individual ZIP-level shifts rather than a citywide move.
Similar Markets in TN
If you’re shopping Tennessee, these markets are worth comparing.
- Kingsport — the closest neighbor in the Tri-Cities region, similar small-market dynamics.
- Knoxville — larger metro with a deeper inventory pool.
- Chattanooga — bigger and growing 5.1%, faster than Johnson City but still moderate.
- Nashville — the state’s expensive flagship; Johnson City buyers priced out of Nashville often look here instead.
- Jackson — another smaller Tennessee market with comparable affordability.
Frequently Asked Questions
What is the average home price in Johnson City?
The average home price in Johnson City, TN is $289,608 as of February 2026. That figure is based on the Zillow Home Value Index across the city’s three primary ZIP codes — 37601, 37604, and 37615.
Are home prices going up or down in Johnson City?
Prices are down 0.6% year over year. The market peaked in March 2025 at $291,361, slid through December, then ticked higher in January and February 2026. Net movement over 12 months is small.
Is it cheaper to rent or buy in Johnson City?
Renting is cheaper month-to-month. The average rent across the three ZIPs runs about $1,409, while a mortgage on the median $289,608 home with 20% down comes to roughly $1,890 once taxes and insurance are included — a $481 gap.
What is the most affordable neighborhood in Johnson City?
ZIP 37601 is the cheapest, with a median home value of $255,616 — about 12% below the city average. It also has the lowest rent at $1,271 a month, making it the most affordable area for both buyers and renters.
Methodology
Home values are based on the Zillow Home Value Index (ZHVI), a smoothed measure of typical home values in the 35th to 65th percentile range. Rent estimates use the Zillow Observed Rent Index (ZORI). Population figures come from the U.S. Census Bureau Population Estimates Program (2020-2024 vintage). All datasets are publicly available. Housing data updated 2026-02-28.