Knoxville Home Prices: $390K, Up 1.2% — 17 ZIPs Analyzed (2026)
$390,300. That is what a typical home in Knoxville costs as of February 2026. Prices are up 1.2% from a year ago, and they have edged higher in each of the last seven months.
Quick answer: The average home price in Knoxville, TN is $390,300 as of February 2026, up 1.2% year over year according to Zillow.
Current Home Prices in Knoxville
Knoxville’s typical home value sits at $390,300. That number is the midpoint across 17 ZIP codes inside the city. Some neighborhoods cost three times as much as others.
| Metric | Value |
|---|---|
| Median home value | $390,300 |
| Year-over-year change | +1.2% |
| Cheapest ZIP | $200,188 (37915) |
| Priciest ZIP | $647,346 (37902) |
| ZIPs analyzed | 17 |
| Data through | February 2026 |
The 1.2% annual gain is modest. It trails inflation for most of 2025, which means Knoxville homeowners broke even in real terms rather than getting richer on paper.
You see the stratification clearly in the ZIP data. The top end — downtown (37902) and West Knoxville (37922) — clears $625,000. The bottom end — East Knoxville (37915) and Mechanicsville-adjacent areas — sits near $200,000. That is a $447,000 spread within city limits.
For buyers, the middle of the market is where most listings cluster. ZIPs 37918 (Fountain City), 37920 (South Knoxville), and 37921 (Lonsdale) all fall between $285,000 and $328,000. These are the neighborhoods where a household earning the Knox County median can realistically compete.
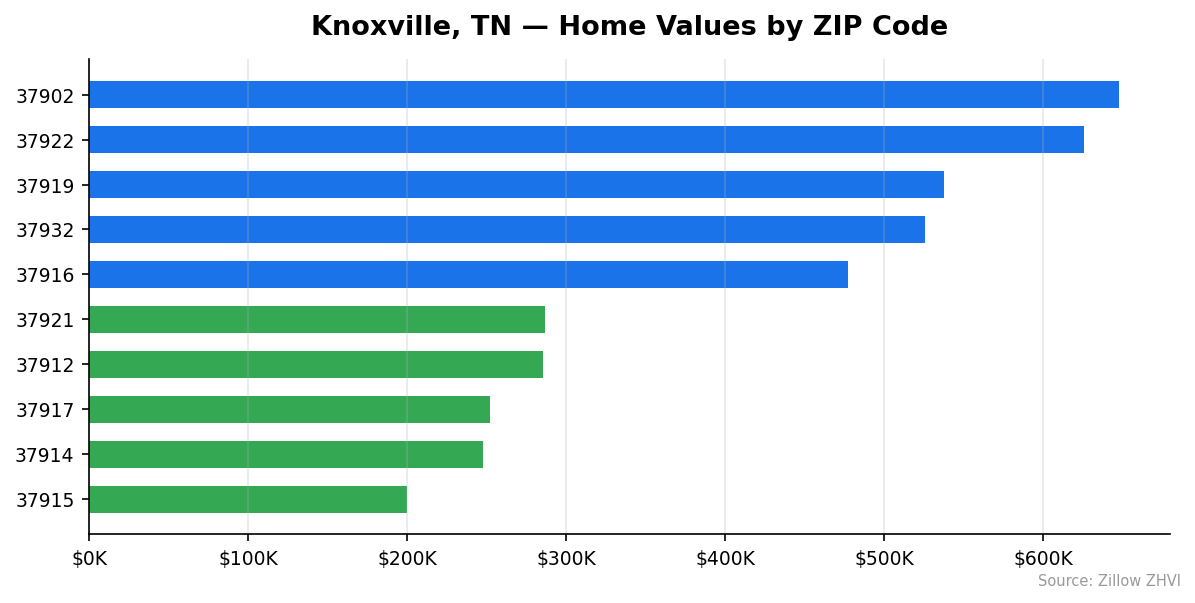
Knoxville Home Prices by Neighborhood
Seventeen ZIP codes. A $447,000 gap between cheapest and priciest. Here is the full breakdown.
| ZIP | Typical Home Value | Typical Rent |
|---|---|---|
| 37902 | $647,346 | $2,168 |
| 37922 | $625,547 | $1,800 |
| 37919 | $537,834 | $1,618 |
| 37932 | $525,710 | $1,916 |
| 37916 | $477,384 | $1,903 |
| 37931 | $425,310 | $1,713 |
| 37923 | $394,197 | $1,745 |
| 37938 | $382,195 | — |
| 37909 | $371,858 | $2,228 |
| 37924 | $332,971 | — |
| 37918 | $327,684 | $1,596 |
| 37920 | $315,161 | $1,783 |
| 37921 | $286,674 | $1,832 |
| 37912 | $285,349 | $1,304 |
| 37917 | $251,797 | $1,607 |
| 37914 | $247,896 | $1,491 |
| 37915 | $200,188 | — |
Most Expensive
ZIP 37902 covers downtown Knoxville at $647,346, roughly 66% above the city median and the only ZIP where typical rent tops $2,100. 37922 in West Knoxville runs $625,547 with rents around $1,800. 37919 in Bearden holds the third spot at $537,834, pairing premium prices with mid-range rents near $1,618.
Most Affordable
ZIP 37915, east of downtown, is the cheapest in the city at $200,188 — less than a third of what 37902 costs. 37914 sits at $247,896 with rents around $1,491. 37917, just north of downtown, rounds out the bottom three at $251,797 with rent near $1,607.
Rent vs Buy in Knoxville
The math favors renting for now.
Take a $390,300 home with 20% down. That leaves a $312,240 loan. At 7% on a 30-year mortgage, the payment is about $2,077 before taxes and insurance. Add property tax and insurance and you clear $2,600 a month.
Typical rent across Knoxville ZIPs ranges from $1,304 (37912, Inskip) to $2,228 (37909, West Hills). The median ZIP rent is around $1,745. That is roughly $850 a month less than a mortgage on a median-priced home.
| Cost | Amount |
|---|---|
| Median home price | $390,300 |
| 20% down payment | $78,060 |
| Est. monthly mortgage + taxes | ~$2,600 |
| Median ZIP rent | ~$1,745 |
| Monthly difference | ~$855 |
Rent is cheaper in every Knoxville ZIP with data available. Even in pricier areas like 37902 ($2,168) and 37909 ($2,228), renters pay less than owners — and skip the down payment entirely.
Buying makes sense if you plan to stay seven-plus years and expect prices to keep rising. With Knoxville at 1.2% annual appreciation, you are betting on a slow burn, not a windfall.
Population Growth and Migration
Knoxville is growing, but at a slower pace than other Tennessee cities.
The city added 7,495 residents between 2020 and 2024 — a 3.9% gain. That is steady, not explosive. Each year since 2020 has seen incremental gains with no declines.
| Year | Population |
|---|---|
| 2020 | 191,227 |
| 2021 | 192,158 |
| 2022 | 196,210 |
| 2023 | 197,463 |
| 2024 | 198,722 |
Compare that with the rest of the state:
| City | 2024 Population | 4-Yr Growth |
|---|---|---|
| Smyrna | 60,302 | +12.7% |
| Clarksville | 185,690 | +10.8% |
| Murfreesboro | 168,387 | +9.5% |
| Franklin | 89,142 | +5.9% |
| Chattanooga | 191,496 | +5.1% |
| Knoxville | 198,722 | +3.9% |
Knoxville is the slowest grower among these peers. The Nashville suburbs — Smyrna, Murfreesboro, Franklin — are pulling people at two to three times Knoxville’s rate.
What this means for housing: Knoxville’s demand is real but measured. You are not competing with a migration wave. That helps explain why prices rose only 1.2% year over year while faster-growing Tennessee cities saw sharper moves.
Knoxville Housing Market Trends
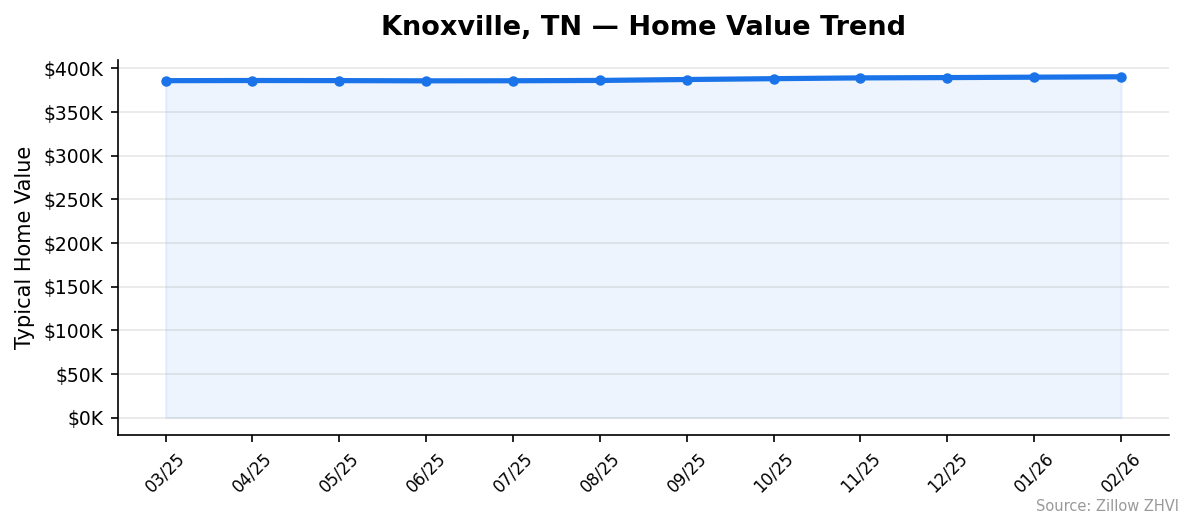
Twelve months of data. One clear direction: slowly up.
| Month | Typical Value |
|---|---|
| Feb 2026 | $390,300 |
| Jan 2026 | $389,854 |
| Dec 2025 | $389,398 |
| Nov 2025 | $389,040 |
| Oct 2025 | $388,139 |
| Sep 2025 | $387,181 |
| Aug 2025 | $386,125 |
| Jul 2025 | $385,757 |
| Jun 2025 | $385,658 |
| May 2025 | $385,927 |
| Apr 2025 | $386,046 |
| Mar 2025 | $385,859 |
The market dipped in the spring. From March to June 2025, values slid by about $200. Then momentum flipped. Since June, prices have added roughly $4,600 — small but consistent.
The monthly gains are tiny. Typical moves of $350 to $1,000. That is a slow-moving market, not a hot one. For buyers, it means less pressure to rush. For sellers, it means pricing at market is more important than chasing a bidding war that is not coming.
Is Knoxville a Good Place to Buy in 2026?
It depends on your timeline.
The numbers say Knoxville is a stable market, not a growing one. A 1.2% annual gain means your home appreciates slower than inflation. If you are buying as an investment, the math is thin.
If you are buying to live in, the picture shifts. Population is rising. Inventory at the low end — ZIPs 37915, 37914, 37917 — still offers homes under $260,000. That is rare in 2026.
The catch: rent beats buy on pure monthly cost. You need to stay long enough to cover closing costs, maintenance, and the opportunity cost of your down payment. Five to seven years is the break-even window in a 1% appreciation market.
Verdict: Knoxville is a reasonable buy if you are staying long-term. It is not a flip-it-in-two-years market.
Knoxville Housing Market Outlook for 2026-2027
The 3-month trend shows prices adding about $450 per month. If the current pace continues, Knoxville could reach around $392,000 by mid-2026.
That is not a forecast you bet your retirement on. It is an extrapolation from seven months of gentle gains.
Two things could break the trend. Faster population growth would tighten supply and push prices. A rate cut would bring buyers off the sidelines. Neither is in the current data.
For now, expect more of the same: sub-2% annual appreciation, a wide spread between cheap and premium ZIPs, and rents that remain more affordable than mortgages. The outlook is steady. Not exciting, not alarming.
Similar Markets in TN
If Knoxville is not the right fit, these Tennessee cities are worth checking:
- Nashville — bigger market, faster growth, higher prices.
- Chattanooga — similar size to Knoxville with a slightly faster 5.1% growth rate.
- Clarksville — fast-growing (+10.8%) Nashville-adjacent market for buyers chasing appreciation.
- Murfreesboro — strong growth (+9.5%) in the Nashville metro, often with suburban pricing.
- Memphis — larger city in west Tennessee, typically more affordable than the Nashville metros.
Frequently Asked Questions
What is the average home price in Knoxville?
The typical home in Knoxville is worth $390,300 as of February 2026. That figure is the Zillow Home Value Index across 17 Knoxville ZIP codes.
Are home prices going up or down in Knoxville?
Up, but barely. Prices rose 1.2% over the last year. The market has added small monthly gains for seven months straight, averaging around $450 per month.
Is it cheaper to rent or buy in Knoxville?
Renting is cheaper month to month. A mortgage on a median-priced $390,300 home runs roughly $2,600 once you include taxes and insurance, while the median Knoxville rent is around $1,745 — an $855 monthly gap.
What is the most affordable neighborhood in Knoxville?
ZIP 37915 east of downtown is the cheapest at $200,188, less than a third of the priciest ZIP. ZIP 37914 ($247,896) and ZIP 37917 ($251,797) round out the three most affordable areas.
Methodology
Home values are based on the Zillow Home Value Index (ZHVI), a smoothed measure of typical home values in the 35th to 65th percentile range. Rent estimates use the Zillow Observed Rent Index (ZORI). Population figures come from the U.S. Census Bureau Population Estimates Program (2020-2024 vintage). All datasets are publicly available. Housing data updated 2026-02-28.