Maryville Home Prices: $380K, Up 0.6% — 3 ZIPs Analyzed (2026)
$379,812. That is the typical home price in Maryville, TN as of February 2026. Values are up 0.6% from a year ago — barely moving, but moving up.
Quick answer: The average home price in Maryville, TN is $379,812 as of February 2026, up 0.6% year over year according to Zillow.
Current Home Prices in Maryville
The typical Maryville home sits at $379,812. The cheapest ZIP in town starts at $347,235 and the priciest reaches $401,178 — a spread of about $54,000 between the bottom and top of the market.
| Metric | Value |
|---|---|
| Median home price | $379,812 |
| Year-over-year change | +0.6% |
| Lowest ZIP median | $347,235 |
| Highest ZIP median | $401,178 |
| ZIP codes tracked | 3 |
| Data through | February 2026 |
A 0.6% gain barely keeps pace with anything. For context, that is roughly $2,300 added to the typical home value over twelve months. A buyer who waited a year to purchase paid almost the same price — but likely faced higher mortgage rates in the process.
The price floor matters here. Maryville does not have a true bargain ZIP. Even the cheapest tracked area runs above $347K, which puts every neighborhood in the upper third of national home values. This is a small market with limited spread, so price-shopping by ZIP only gets you so far.
The flatness of the year-over-year number masks a turnaround. Prices actually dipped through the summer of 2025 before recovering. The market that exists today is not the market that existed nine months ago.
Maryville Home Prices by Neighborhood
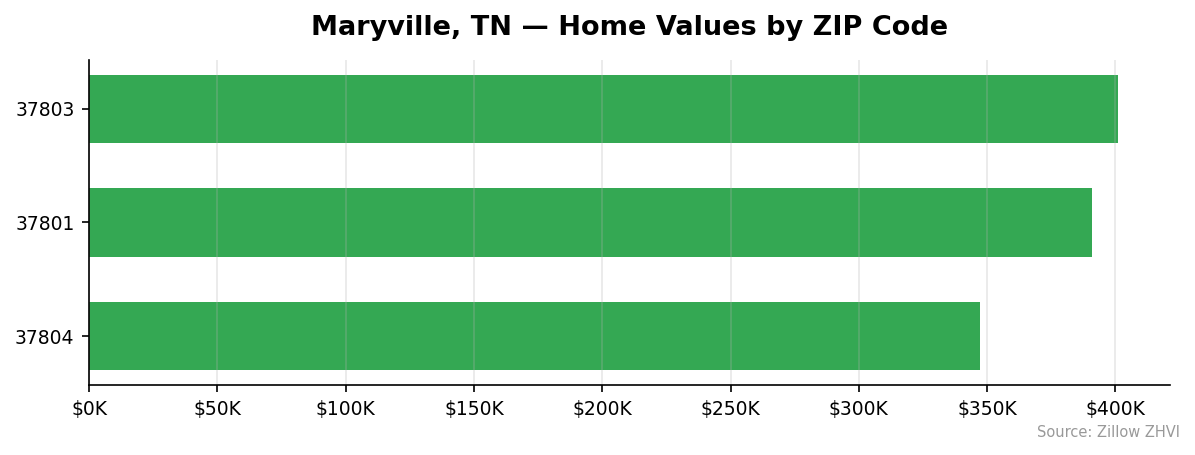
Three ZIP codes cover Maryville. Prices vary by about 16% from cheapest to most expensive.
| ZIP Code | Median Home Price | Median Rent | vs. City Avg |
|---|---|---|---|
| 37803 | $401,178 | $1,971 | +5.6% |
| 37801 | $391,024 | $1,848 | +3.0% |
| 37804 | $347,235 | $1,838 | -8.6% |
Most Expensive
- 37803 — $401,178. The top of the Maryville market. Rents are also the highest in town at $1,971, suggesting steadier demand from both buyers and tenants.
- 37801 — $391,024. Sits just above the citywide median. Rents track slightly lower than 37803 despite home values being close, which can favor landlords looking at gross yields.
Most Affordable
- 37804 — $347,235. The cheapest ZIP in Maryville, nearly $54,000 below 37803. Rents are also the lowest in town at $1,838, so buyers get a discount but so do renters.
Rent vs Buy in Maryville
Median rent across Maryville’s three ZIPs averages roughly $1,886 per month, ranging from $1,838 in 37804 to $1,971 in 37803.
Run the buy-side math on a $379,812 home with 20% down. The borrower puts up $75,962 in cash. The remaining $303,850 at a 7% 30-year fixed mortgage comes out to about $2,022 in principal and interest. Add property taxes (Tennessee runs low, but figure $200/month) and insurance ($150/month) and the monthly cost lands near $2,372 — before any HOA or maintenance.
That is about $486 per month more than the typical rent. Over a year, the buyer pays roughly $5,800 more in monthly costs and ties up $76,000 in down payment.
| Path | Estimated Monthly Cost |
|---|---|
| Rent (city average) | $1,886 |
| Buy ($379,812 home, 20% down, 7%) | $2,372 |
| Difference | +$486 |
The math tilts toward renting on cash flow. Buying still wins on equity and tax treatment over a long enough horizon — but with prices crawling up only 0.6% per year, the appreciation cushion is thin. A Maryville buyer in 2026 is betting on holding the property for several years before the math flips in their favor.
Population Growth and Migration
Maryville added about 361 residents between 2020 and 2024. The city now sits at 32,373 people, up 1.1% over four years.
| Year | Population |
|---|---|
| 2020 | 32,012 |
| 2021 | 32,319 |
| 2022 | 32,692 |
| 2023 | 32,442 |
| 2024 | 32,373 |
The trajectory is not a straight line. Maryville peaked at 32,692 in 2022, lost residents the next two years, and still finished above 2020. Call it growing, but barely.
Stack Maryville against other Tennessee cities and the pace looks even slower:
| City | 2024 Population | 4-Year Growth |
|---|---|---|
| Clarksville | 185,690 | +10.8% |
| Murfreesboro | 168,387 | +9.5% |
| Franklin | 89,142 | +5.9% |
| Chattanooga | 191,496 | +5.1% |
| Knoxville | 198,722 | +3.9% |
| Maryville | 32,373 | +1.1% |
What this means for housing: demand is steady but not accelerating. Maryville is not absorbing the boomtown population pressure that has pushed Middle Tennessee prices higher. That partly explains the 0.6% annual price gain — gentle growth in residents produces gentle growth in prices.
Maryville Housing Market Trends
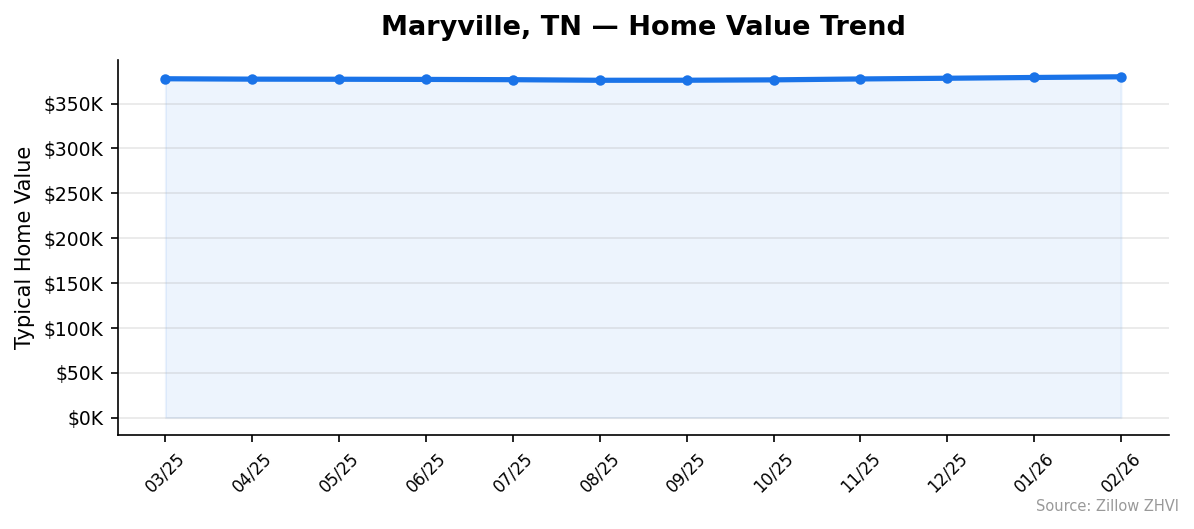
The twelve-month price chart tells a story of decline, bottom, and slow recovery.
| Month | Median Value |
|---|---|
| Mar 2025 | $377,621 |
| Apr 2025 | $377,187 |
| May 2025 | $377,070 |
| Jun 2025 | $376,884 |
| Jul 2025 | $376,585 |
| Aug 2025 | $375,924 |
| Sep 2025 | $375,980 |
| Oct 2025 | $376,384 |
| Nov 2025 | $377,408 |
| Dec 2025 | $378,180 |
| Jan 2026 | $379,044 |
| Feb 2026 | $379,812 |
Prices fell every month from March through August 2025, bottoming at $375,924. The reversal started in September. Since then, values have climbed for six straight months, gaining about $3,888 — roughly 1%.
The recent pace is faster than the annual figure suggests. From November 2025 to February 2026, prices rose about $2,400, or near 0.6% in just three months. If that quarterly pace held for a full year, annual gains would land closer to 2.5%.
Is Maryville a Good Place to Buy in 2026?
The data points to a balanced market leaning slightly toward sellers right now. Six months of consecutive price gains shows demand is firm enough to absorb inventory. But the gains are small — under 1% in half a year — so sellers are not in a position to push prices aggressively.
For buyers, the lack of a dramatic price drop in 2025 means you missed the easy discount window. Maryville’s August 2025 bottom was only 0.5% below where prices sat a year earlier. There was no crash to catch.
What buyers do get is a smaller market with limited inventory variability. With only three ZIPs and a $54K spread between cheapest and priciest, choices are narrow. The decision is more about which ZIP fits your needs than chasing the best price.
Population growth of 1.1% over four years suggests demand will stay steady rather than surge. That points to a market where prices grind upward slowly — not a place to flip houses, but not a market in trouble either.
Maryville Housing Market Outlook for 2026-2027
The three-month trend shows prices rising about $800 per month. If that current pace continues through the spring, values would land near $382,000 by May 2026 and approach $385,000 by August.
The six-month recovery has been steady without acceleration. Monthly gains have ranged from roughly $400 to $1,000, with no sign of a breakout. That argues for more of the same — small, consistent upward pressure rather than a sudden jump.
The slow population growth caps the upside. Without a wave of new residents, demand cannot easily outpace inventory by enough to drive double-digit gains. The most likely 6-12 month outcome is annual appreciation in the 1-3% range, similar to what the market has produced since late 2025.
Similar Markets in TN
- Knoxville — the nearest big-city comparison and the metro Maryville belongs to.
- Chattanooga — another mid-size Tennessee market with stronger population growth.
- Nashville — the state’s largest market, useful for benchmarking how much Maryville’s $380K median saves you.
- Murfreesboro — a high-growth Middle Tennessee market for buyers wanting more momentum.
- Johnson City — another East Tennessee small city worth comparing on price and rent.
Frequently Asked Questions
What is the average home price in Maryville?
The average home price in Maryville, TN is $379,812 as of February 2026. Across the city’s three ZIP codes, values range from $347,235 in 37804 to $401,178 in 37803. That puts Maryville in the upper third of national home prices.
Are home prices going up or down in Maryville?
Prices are up 0.6% year over year. The market dipped through summer 2025, bottomed at $375,924 in August, and has climbed every month since. The three-month pace works out to roughly 2.5% annualized.
Is it cheaper to rent or buy in Maryville?
Renting costs about $486 less per month on the current numbers. Average rent runs near $1,886, while a typical mortgage on a $379,812 home with 20% down at 7% comes to about $2,372 including taxes and insurance.
What is the most affordable neighborhood in Maryville?
ZIP 37804 is the cheapest at $347,235 — about 9% below the city average and $54,000 less than the priciest ZIP. Rents there are also the lowest in town at $1,838 per month.
Methodology
Home values are based on the Zillow Home Value Index (ZHVI), a smoothed measure of typical home values in the 35th to 65th percentile range. Rent estimates use the Zillow Observed Rent Index (ZORI). Population figures come from the U.S. Census Bureau Population Estimates Program (2020-2024 vintage). All datasets are publicly available. Housing data updated 2026-02-28.