Chattanooga Home Prices: $294K, Down 1.3% — 13 ZIPs (2026)
$294K. That’s what a typical home costs in Chattanooga right now — and it’s actually less than it was a year ago. Prices have slipped 1.3% over the past twelve months, part of a slow, steady decline that started in spring 2025. Across 13 ZIP codes, values range from $128K to $461K.
Quick answer: The average home price in Chattanooga, TN is $293,708 as of February 2026, down 1.3% year over year according to Zillow.
Current Home Prices in Chattanooga
| Metric | Value |
|---|---|
| Median Home Value | $293,708 |
| Year-over-Year Change | -1.3% |
| Lowest ZIP Value | $128,483 |
| Highest ZIP Value | $461,198 |
| Number of ZIPs Tracked | 13 |
| Data as of | February 2026 |
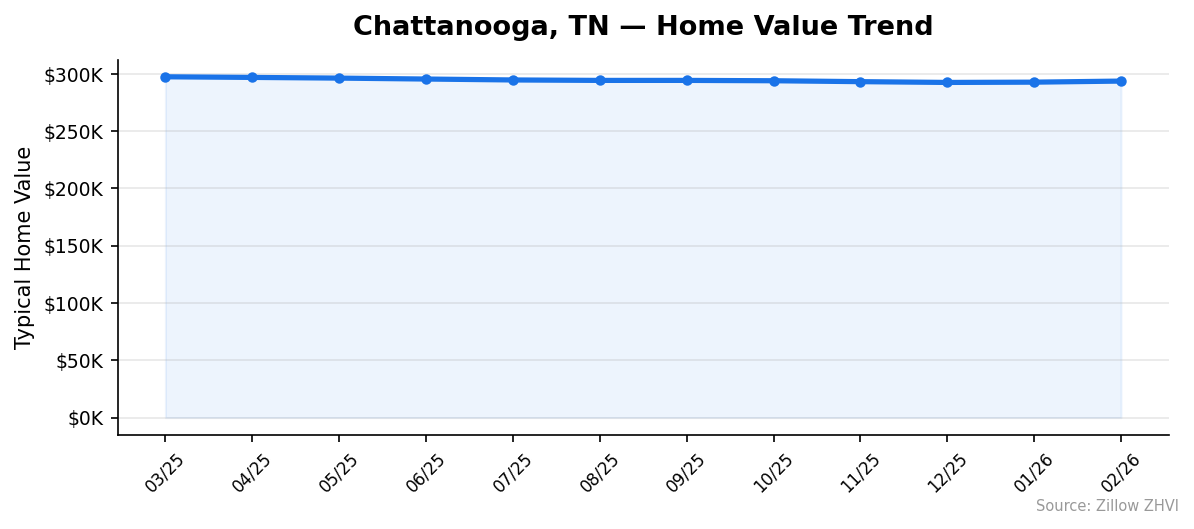
Chattanooga’s median sits well below the typical Tennessee metro. The 1.3% annual decline is modest — not a crash, but a correction. Prices peaked in March 2025 at $297,458 and have shed roughly $3,750 since then.
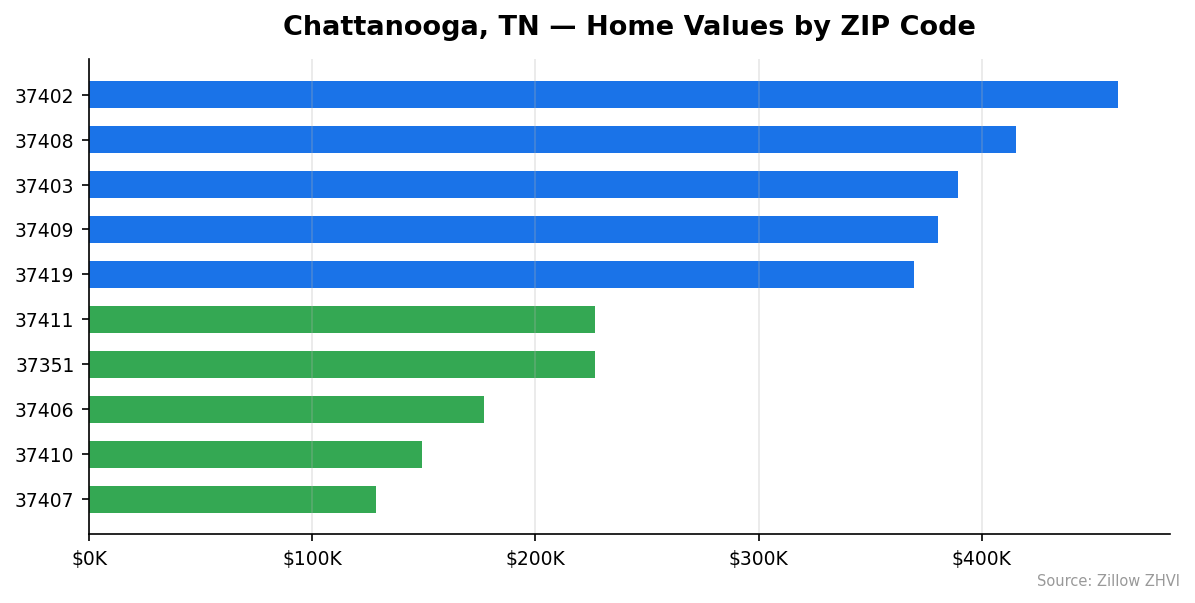
The spread between the cheapest and most expensive ZIP tells you a lot about this market. A buyer in the 37407 ZIP can get in at $128K, while downtown’s 37402 runs $461K. That’s a 3.6x gap within the same city.
For buyers who’ve been waiting, the numbers are finally moving in their favor. Sellers aren’t panicking — the declines are measured, roughly $300-$500 per month. But the direction is clear.
Chattanooga Home Prices by Neighborhood
| ZIP Code | Typical Home Value | Monthly Rent |
|---|---|---|
| 37402 | $461,198 | $1,556 |
| 37408 | $415,131 | $1,482 |
| 37403 | $389,189 | $1,567 |
| 37409 | $380,323 | $1,669 |
| 37419 | $369,730 | $1,625 |
| 37421 | $358,207 | $1,460 |
| 37416 | $285,102 | $1,402 |
| 37404 | $250,946 | $1,602 |
| 37411 | $226,858 | $1,374 |
| 37351 | $226,817 | N/A |
| 37406 | $177,026 | $1,407 |
| 37410 | $149,197 | $1,435 |
| 37407 | $128,483 | N/A |
Most Expensive ZIPs
37402 leads at $461,198 — more than 57% above the city median. Rents here run $1,556/month, surprisingly moderate for the price tier.
37408 comes in at $415,131 with rents of $1,482/month. Home values here are 41% above the Chattanooga average.
37403 rounds out the top three at $389,189. Rents in this ZIP are $1,567/month — the third-highest in the city.
Most Affordable ZIPs
37407 is Chattanooga’s cheapest ZIP at $128,483 — less than half the city median. Rent data is not available for this area.
37410 offers homes at $149,197 with rents of $1,435/month. At that price-to-rent ratio, this ZIP leans toward being better for investors than owner-occupants.
37406 sits at $177,026 with $1,407/month in rent. You’re paying 60% of the city median to buy here, but rents aren’t proportionally cheaper.
Rent vs Buy in Chattanooga
The average rent across Chattanooga’s tracked ZIPs is approximately $1,507/month. To put that in context, here’s what a mortgage looks like on the median home.
| Cost Component | Monthly |
|---|---|
| Median Home Price | $293,708 |
| Loan Amount (20% down) | $234,966 |
| Est. Mortgage Payment (7%, 30yr) | ~$1,563 |
| Average Citywide Rent | ~$1,507 |
| Difference | ~$56/month |
Buying is only about $56/month more expensive than renting on a straight payment basis. That’s before property taxes, insurance, and maintenance — which typically add $300-$500/month for a home in this price range. On pure monthly cash flow, renting still wins.
But the math varies wildly by ZIP. In 37404, rent runs $1,602/month on a home worth $250,946. You could buy there and pay less on a mortgage than you would in rent. In 37402, the opposite is true — homes cost $461K but rent is only $1,556.
If you’re eyeing the affordable ZIPs like 37410 or 37406, renting costs nearly as much as the mortgage would. Buying makes more sense in those areas if you plan to stay.
Population Growth and Migration
Chattanooga’s population reached 191,496 in 2024, up 5.1% from 182,271 in 2020. The city is growing — and has been every year since a brief dip in 2021.
| Year | Population |
|---|---|
| 2020 | 182,271 |
| 2021 | 181,885 |
| 2022 | 185,030 |
| 2023 | 188,080 |
| 2024 | 191,496 |
That 2021 blip was small — just 386 people. Since then, the city has added roughly 3,000 residents per year.
How does Chattanooga stack up against other Tennessee cities?
| City | 2024 Population | 4-Year Growth |
|---|---|---|
| Smyrna | 60,302 | 12.7% |
| Clarksville | 185,690 | 10.8% |
| Murfreesboro | 168,387 | 9.5% |
| Franklin | 89,142 | 5.9% |
| Chattanooga | 191,496 | 5.1% |
| Knoxville | 198,722 | 3.9% |
Chattanooga’s 5.1% growth is solid but trails the faster-growing suburbs of Nashville like Smyrna and Murfreesboro. The steady population gains keep a floor under housing demand, even as prices soften. More people means more renters and eventual buyers entering the market.
Chattanooga Housing Market Trends
Here’s how the median home value has moved month by month over the past year.
| Month | Median Value | Change from Prior Month |
|---|---|---|
| Mar 2025 | $297,458 | — |
| Apr 2025 | $296,910 | -$548 |
| May 2025 | $296,304 | -$606 |
| Jun 2025 | $295,496 | -$808 |
| Jul 2025 | $294,690 | -$806 |
| Aug 2025 | $294,302 | -$388 |
| Sep 2025 | $294,307 | +$5 |
| Oct 2025 | $294,005 | -$302 |
| Nov 2025 | $293,211 | -$794 |
| Dec 2025 | $292,525 | -$686 |
| Jan 2026 | $292,772 | +$247 |
| Feb 2026 | $293,708 | +$936 |
The trend is mostly downward from March 2025 through December 2025 — nine months of gradual declines. But look at January and February 2026. Prices ticked up in both months. February’s $936 jump is the largest single-month gain in the entire period.
That doesn’t mean the slide is over. One or two months of gains after a long decline could be seasonal. Spring typically lifts prices as more buyers enter the market. But it’s the first sign of stabilization since the downturn began.
Is Chattanooga a Good Place to Buy in 2026?
The numbers point to a buyer-friendly market. Prices are down 1.3% year over year, inventory pressure has eased, and you’re not competing against the frenzied appreciation of 2021-2022.
Here’s what works in your favor: the city’s median of $294K is accessible compared to many Southern metros. A 20% down payment is roughly $59K. Monthly payments on the median home are close to what you’d pay in rent anyway.
The ZIP-level spread gives you options. If you need to get in under $200K, three ZIPs can get you there. If you want a premium location and have the budget, the $350K-$460K range covers the most expensive areas.
Population growth of 5.1% over four years means demand isn’t disappearing. Chattanooga isn’t overbuilding relative to its growth — the price declines look more like a normalization than a collapse.
If you’re a renter spending $1,500/month and planning to stay at least five years, buying in the mid-priced ZIPs is worth running the numbers on.
Chattanooga Housing Market Outlook for 2026-2027
The 12-month trend shows a clear pattern: steady decline from March through December 2025, then a bounce in early 2026. February’s $936 monthly gain was the strongest in the dataset.
If the early-2026 rebound holds through spring and summer, prices could flatten in the $293K-$296K range for the rest of the year. The decline was never steep — about $5,000 peak-to-trough — so a full recovery to March 2025 levels is plausible by late 2026.
If the bounce is purely seasonal and fades by summer, expect prices to settle in the $290K-$293K band. Either way, the data doesn’t suggest a sharp drop ahead. The 3-month trend from December to February shows accelerating gains: -$686, then +$247, then +$936.
For buyers, the window of maximum softness may have been December 2025 at $292,525. For sellers, the market isn’t punishing you — but don’t expect bidding wars.
Similar Markets in TN
If you’re exploring Tennessee options beyond Chattanooga, here are other cities to compare:
- Nashville — The state’s largest market, with higher prices and faster appreciation than Chattanooga.
- Knoxville — Similar population size to Chattanooga with slightly slower growth at 3.9%.
- Clarksville — Growing fast at 10.8% population growth, worth watching for affordability.
- Memphis — Tennessee’s other major metro, often cheaper than Chattanooga.
- Cleveland — A smaller market just north of Chattanooga in the same metro area.
Frequently Asked Questions
What is the average home price in Chattanooga?
The average home price in Chattanooga is $293,708 as of February 2026. That figure represents the typical home value across all 13 tracked ZIP codes, where prices range from $128,483 in the 37407 ZIP to $461,198 in 37402.
Are home prices going up or down in Chattanooga?
Prices are down 1.3% compared to a year ago. The decline has been gradual — roughly $300-$800 per month through most of 2025. However, January and February 2026 both showed gains, suggesting the market may be stabilizing.
Is it cheaper to rent or buy in Chattanooga?
On a pure mortgage-vs-rent basis, the two are close. The average rent across tracked ZIPs is about $1,507/month, while a mortgage on the median home runs roughly $1,563/month with 20% down. After adding taxes, insurance, and maintenance, renting is cheaper on a monthly basis — but buying builds equity over time.
What is the most affordable neighborhood in Chattanooga?
ZIP code 37407 is the most affordable at $128,483 — less than half the city median. ZIP 37410 at $149,197 and 37406 at $177,026 are also well below average. These areas offer the lowest entry point for buyers on a budget.
Methodology
Home values are based on the Zillow Home Value Index (ZHVI), a smoothed measure of typical home values in the 35th to 65th percentile range. Rent estimates use the Zillow Observed Rent Index (ZORI). Population figures come from the U.S. Census Bureau Population Estimates Program (2020-2024 vintage). All datasets are publicly available. Housing data updated 2026-02-28.