Murfreesboro Home Prices: $416K, Flat YoY — 4 ZIPs Analyzed (2026)
$416,145. That’s what a typical home costs in Murfreesboro, TN right now — and that number hasn’t moved in a year. While other Tennessee markets swing up or down, Murfreesboro’s housing market has been remarkably still, with prices flat year over year as of February 2026.
Quick answer: The average home price in Murfreesboro, TN is $416,145 as of February 2026, unchanged (0.0%) year over year according to Zillow.
Current Home Prices in Murfreesboro
Murfreesboro sits in the Nashville-Davidson–Murfreesboro–Franklin metro area, and its $416K median puts it below Nashville proper but above many smaller Tennessee cities.
| Metric | Value |
|---|---|
| Median Home Price | $416,145 |
| Year-over-Year Change | 0.0% |
| Lowest ZIP Value | $366,758 |
| Highest ZIP Value | $440,129 |
| Number of ZIPs Tracked | 4 |
| Data as of | February 2026 |
Zero percent growth sounds boring. It’s actually useful information. Buyers aren’t chasing a rising market. Sellers aren’t watching equity evaporate. The market has found a holding pattern.
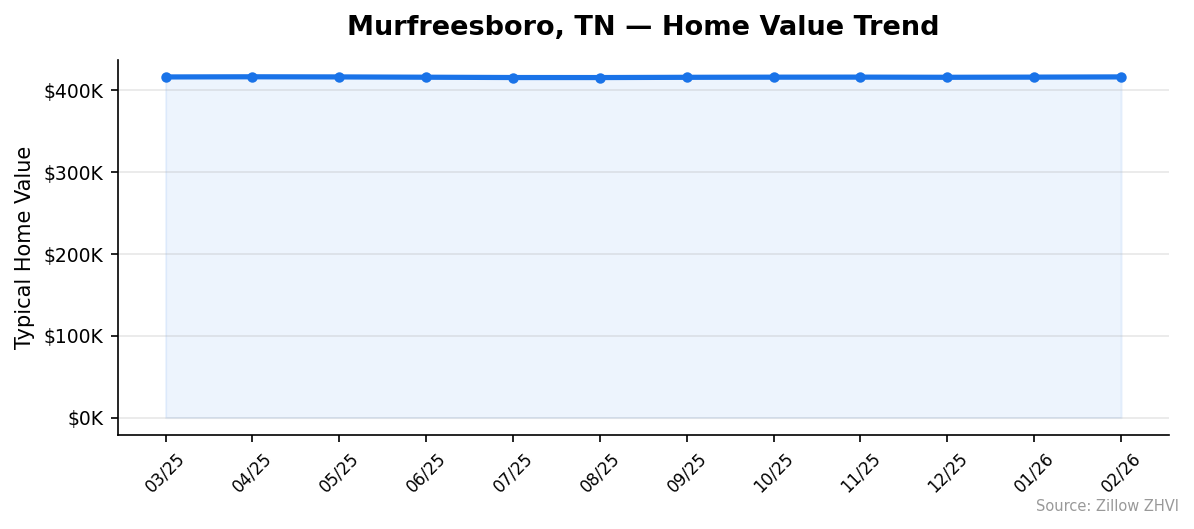
Over the past 12 months, Murfreesboro’s median bounced inside a $1,000 range — from a low of $415,351 in August 2025 to $416,284 in April 2025. That’s less than 0.3% movement top to bottom. For context, a $1,000 swing on a $416K home is rounding error.
The flat trend means buyers have time. There’s no urgency from rapid appreciation, and no discount from a correction. What you see is what you get.
Murfreesboro Home Prices by Neighborhood
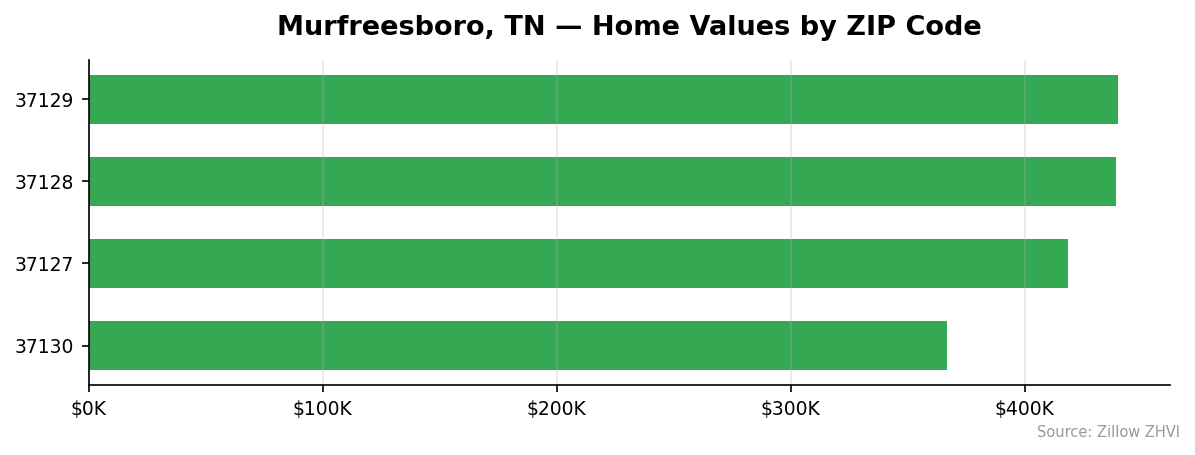
Four ZIP codes cover Murfreesboro. The price gap between the cheapest and most expensive is about $73,000.
| ZIP Code | Median Home Value | Median Rent |
|---|---|---|
| 37129 | $440,129 | $1,823/mo |
| 37128 | $438,935 | $1,722/mo |
| 37127 | $418,759 | $1,699/mo |
| 37130 | $366,758 | $1,512/mo |
Most Expensive
37129 tops the list at $440,129 with rents to match at $1,823/month — roughly 6% above the city median. 37128 is nearly identical at $438,935, just $1,200 less, with slightly lower rents at $1,722/month.
Most Affordable
37130 is the clear value play at $366,758, sitting $49,387 below the city average. Rents here are also the lowest at $1,512/month. If you’re looking for the cheapest entry point into Murfreesboro, this is it. 37127 splits the middle at $418,759, close to the city median but about $21K cheaper than the top two ZIPs.
Rent vs Buy in Murfreesboro
The average rent across Murfreesboro’s four ZIP codes runs about $1,689 per month.
Now compare that to buying. On a $416,145 home with 20% down ($83,229), you’d finance $332,916. At a 7% mortgage rate over 30 years, the principal and interest payment alone comes to roughly $2,215/month. Add property taxes and insurance, and you’re looking at $2,500 or more.
| Monthly Cost | |
|---|---|
| Average Rent | ~$1,689 |
| Mortgage Payment (P&I, 20% down, 7%) | ~$2,215 |
| Estimated Total (with taxes/insurance) | ~$2,500+ |
That’s a gap of at least $500/month in favor of renting. On pure monthly cash flow, renting wins.
But Murfreesboro’s 9.5% population growth over four years tells a different story for long-term buyers. More people moving in means sustained housing demand. If you plan to stay five or more years, the equity-building math starts to shift. If you need flexibility or are saving for a larger down payment, renting at $1,689 is reasonable.
The cheapest ZIP to rent is 37130 at $1,512/month. The most expensive is 37129 at $1,823.
Population Growth and Migration
Murfreesboro is one of the fastest-growing cities in Tennessee. The population grew from 153,816 in 2020 to 168,387 in 2024 — a 9.5% increase in four years.
| Year | Population |
|---|---|
| 2020 | 153,816 |
| 2021 | 156,473 |
| 2022 | 162,595 |
| 2023 | 166,023 |
| 2024 | 168,387 |
Growth has been steady every year, with the biggest single-year jump between 2021 and 2022 when the city added over 6,100 residents. The pace has slowed slightly since then but remains strong at about 2,300 new residents per year in 2023-2024.
How does Murfreesboro compare to neighbors?
| City | 2024 Population | 4-Year Growth |
|---|---|---|
| Smyrna | 60,302 | 12.7% |
| Clarksville | 185,690 | 10.8% |
| Murfreesboro | 168,387 | 9.5% |
| Franklin | 89,142 | 5.9% |
| Chattanooga | 191,496 | 5.1% |
| Knoxville | 198,722 | 3.9% |
Smyrna and Clarksville are growing even faster, but Murfreesboro is adding more people in absolute numbers given its larger base. Nearly 15,000 new residents in four years puts consistent pressure on housing supply. The flat prices suggest builders are keeping up — for now.
Murfreesboro Housing Market Trends
Here’s what the last 12 months look like, month by month.
| Month | Avg Home Value | Low | High |
|---|---|---|---|
| Feb 2026 | $416,145 | $366,758 | $440,129 |
| Jan 2026 | $415,871 | $366,356 | $439,904 |
| Dec 2025 | $415,676 | $365,857 | $439,641 |
| Nov 2025 | $415,882 | $365,929 | $439,665 |
| Oct 2025 | $415,827 | $365,942 | $439,690 |
| Sep 2025 | $415,647 | $366,056 | $439,666 |
| Aug 2025 | $415,351 | $366,078 | $439,335 |
| Jul 2025 | $415,382 | $366,298 | $439,247 |
| Jun 2025 | $415,766 | $366,885 | $439,458 |
| May 2025 | $416,119 | $367,546 | $439,627 |
| Apr 2025 | $416,284 | $368,162 | $440,068 |
| Mar 2025 | $416,091 | $368,506 | $440,086 |
The pattern is almost a flat line. Prices dipped slightly mid-year 2025, hitting $415,351 in August, then recovered through winter. The total range over 12 months is just $933 — less than a quarter-percent swing.
One subtle detail: the cheapest ZIP (37130) actually lost about $1,700 in value from March 2025 ($368,506) to February 2026 ($366,758). Meanwhile the most expensive ZIP (37129) held steady. The gap between neighborhoods is widening slightly, even as the city average stays flat.
Is Murfreesboro a Good Place to Buy in 2026?
The data points to a balanced market. No steep appreciation rewards buyers who rush in. No price drops punish those who already bought.
Here’s what works in Murfreesboro’s favor: population growth of 9.5% over four years, membership in the Nashville metro (one of the strongest job markets in the Southeast), and prices well below Nashville’s median. At $416K, you get significantly more house than in Franklin or downtown Nashville.
Here’s what gives pause: 0% appreciation means your home isn’t building equity beyond what you pay down on the mortgage. And the rent-vs-buy gap suggests the market may be at the upper end of what local incomes support.
For owner-occupants planning to stay 5+ years, Murfreesboro offers stability. For investors seeking appreciation, the data doesn’t support that bet right now.
Murfreesboro Housing Market Outlook for 2026-2027
The 3-month trend from December 2025 to February 2026 shows a very slight upward drift — about $470 total, or $157/month. That’s barely above noise.
If the current pace continues, expect prices to stay in the $415K–$417K range through mid-2026. There’s no momentum in either direction to suggest a breakout or a slide.
The population story matters more than the price trend here. With 2,000+ new residents arriving each year, demand isn’t going away. But if builders keep pace with supply — and the flat prices suggest they have been — there’s no reason to expect a sudden spike.
The most likely scenario: continued stagnation in the $415K–$420K band through 2027, barring a major shift in mortgage rates or Nashville metro employment.
Similar Markets in TN
If you’re considering Murfreesboro, these Tennessee cities are worth comparing:
- Nashville — The metro anchor, with higher prices but more job options and urban amenities.
- Clarksville — Growing faster than Murfreesboro at 10.8%, likely at a lower price point.
- Franklin — A wealthier Nashville suburb with higher home values.
- Chattanooga — Smaller-city feel with 5.1% growth and a different cost profile.
- Knoxville — East Tennessee’s hub, growing at a slower 3.9% but with a large university and medical center presence.
Frequently Asked Questions
What is the average home price in Murfreesboro?
The average home price in Murfreesboro is $416,145 as of February 2026. Across the city’s four tracked ZIP codes, values range from $366,758 in ZIP 37130 to $440,129 in ZIP 37129.
Are home prices going up or down in Murfreesboro?
Prices are flat. The year-over-year change is 0.0%, and the 12-month trend shows movement of less than $1,000 in either direction. There is no meaningful upward or downward pressure in the current data.
Is it cheaper to rent or buy in Murfreesboro?
Renting is cheaper on a monthly basis. Average rent across Murfreesboro is about $1,689/month, while a mortgage on the median home runs approximately $2,215/month for principal and interest alone (20% down, 7% rate). Including taxes and insurance, buying costs $800+ more per month than renting.
What is the most affordable neighborhood in Murfreesboro?
ZIP code 37130 has the lowest home values at $366,758 and the lowest rents at $1,512/month. It’s about $49,000 below the city median, making it the most budget-friendly option in Murfreesboro.
Methodology
Home values are based on the Zillow Home Value Index (ZHVI), a smoothed measure of typical home values in the 35th to 65th percentile range. Rent estimates use the Zillow Observed Rent Index (ZORI). Population figures come from the U.S. Census Bureau Population Estimates Program (2020-2024 vintage). All datasets are publicly available. Housing data updated 2026-02-28.