Average Home Price in Los Angeles (2026): Trends, Data & Forecast
$1,079,440. That’s what a typical home costs in Los Angeles as of February 2026. Prices slipped 0.9% over the past year — a small decline, but the first sustained dip after years of relentless gains. Across 97 ZIP codes, values range from $534K to over $3M.
Quick answer: The average home price in Los Angeles, CA is $1,079,440 as of February 2026, down 0.9% year over year according to Zillow.
Current Home Prices in Los Angeles
| Metric | Value |
|---|---|
| Median Home Value | $1,079,440 |
| Year-over-Year Change | -0.9% |
| Lowest ZIP Code Value | $534,334 |
| Highest ZIP Code Value | $3,020,999 |
| ZIP Codes Tracked | 97 |
| Data Month | February 2026 |
A 0.9% drop doesn’t sound like much. On a million-dollar home, that’s roughly $9,700 less than a year ago. Not enough to change your buying power, but it breaks a long stretch where prices only moved in one direction.
The spread between the cheapest and most expensive ZIP codes is staggering — nearly $2.5 million separates them. Los Angeles isn’t one housing market. It’s dozens of micro-markets stacked on top of each other, and averages hide more than they reveal.
The metro area — Los Angeles-Long Beach-Anaheim — captures a wide economic range, from working-class neighborhoods south of the 10 freeway to the estates above Sunset Boulevard. Your experience of LA real estate depends almost entirely on which ZIP code you’re looking at.
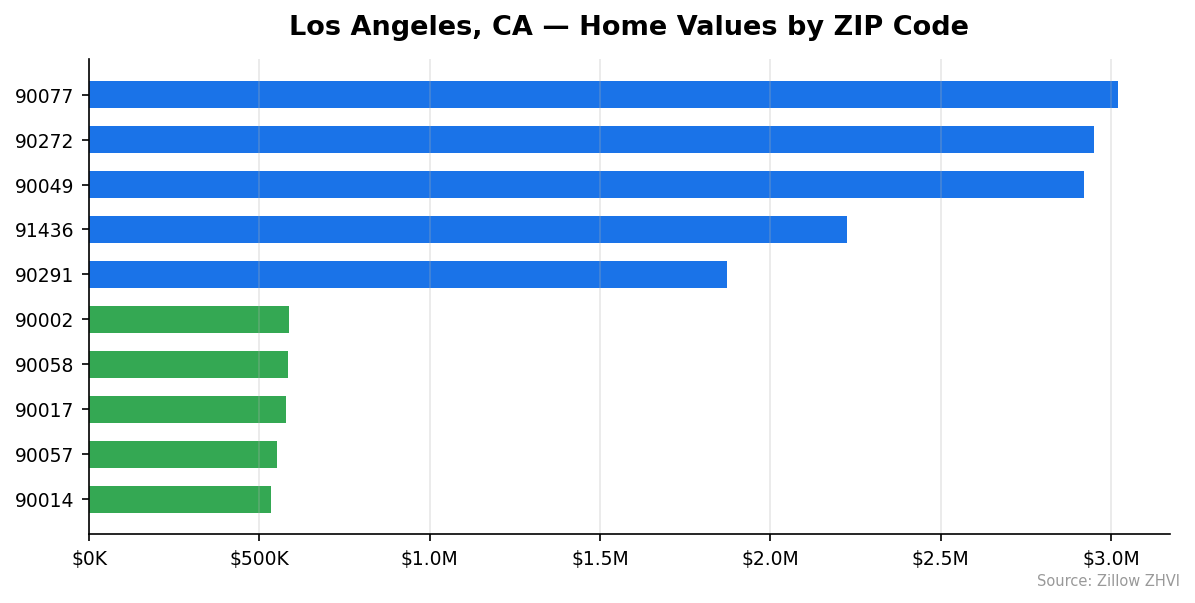
Los Angeles Home Prices by Neighborhood
| ZIP Code | Median Home Value | Typical Rent |
|---|---|---|
| 90077 | $3,020,999 | $12,311 |
| 90272 | $2,951,255 | $7,601 |
| 90049 | $2,921,418 | $4,049 |
| 91436 | $2,224,375 | $4,418 |
| 90291 | $1,873,025 | $3,587 |
| 90036 | $1,824,355 | $2,942 |
| 90064 | $1,818,554 | $3,494 |
| 90027 | $1,751,694 | $2,518 |
| 90048 | $1,727,903 | $3,478 |
| 90066 | $1,692,505 | $2,971 |
| 91604 | $1,683,002 | $3,168 |
| 90068 | $1,623,892 | $3,036 |
| 90003 | $597,854 | $2,499 |
| 90035 | $1,585,878 | $3,322 |
| 90067 | $1,568,210 | $8,105 |
| 90045 | $1,471,987 | $2,853 |
| 90046 | $1,455,566 | $2,741 |
| 91403 | $1,451,063 | $2,829 |
| 91423 | $1,433,396 | $2,709 |
| 90034 | $1,416,672 | $2,671 |
| 90004 | $1,411,648 | $2,205 |
| 90024 | $1,347,900 | $3,982 |
| 90094 | $1,347,422 | $4,259 |
| 91356 | $1,334,677 | $3,005 |
| 90039 | $1,324,695 | $3,036 |
| 91364 | $1,301,211 | $3,601 |
| 90041 | $1,266,390 | $2,908 |
| 91607 | $1,232,064 | $2,769 |
| 91326 | $1,218,603 | $3,906 |
| 90019 | $1,213,370 | $2,812 |
| 90026 | $1,142,513 | $2,605 |
| 91367 | $1,114,391 | $2,896 |
| 91401 | $1,105,308 | $2,582 |
| 90065 | $1,094,092 | $2,639 |
| 90025 | $1,080,759 | $3,121 |
| 91602 | $1,058,391 | $2,666 |
| 90008 | $1,055,243 | $2,242 |
| 90038 | $1,030,942 | $2,820 |
| 91325 | $1,023,550 | $2,365 |
| 90042 | $1,000,189 | $2,729 |
| 91307 | $995,877 | $4,365 |
| 91344 | $987,841 | $3,256 |
| 91411 | $970,244 | $2,467 |
| 91316 | $957,507 | $2,990 |
| 90010 | $957,827 | $3,016 |
| 90029 | $948,024 | $2,151 |
| 91311 | $937,110 | $2,984 |
| 91324 | $930,758 | $2,765 |
| 91304 | $930,339 | $2,443 |
| 90016 | $927,677 | $3,268 |
| 90293 | $923,351 | $3,366 |
| 91040 | $909,147 | $2,240 |
| 91601 | $907,466 | $2,642 |
| 91042 | $898,366 | $2,240 |
| 90005 | $884,011 | $2,398 |
| 90007 | $881,235 | $2,347 |
| 90021 | $881,446 | $2,788 |
| 91343 | $876,289 | $2,524 |
| 90732 | $875,476 | $3,290 |
| 91606 | $872,040 | $2,883 |
| 90028 | $863,331 | $2,615 |
| 91605 | $853,898 | $2,030 |
| 91406 | $846,464 | $2,188 |
| 90710 | $833,745 | $2,649 |
| 90018 | $830,481 | $2,299 |
| 91306 | $828,751 | $2,863 |
| 91405 | $823,862 | $2,400 |
| 90043 | $822,445 | $2,600 |
| 91345 | $821,770 | Data not available |
| 90731 | $814,401 | $2,552 |
| 91352 | $804,571 | $2,853 |
| 91342 | $797,661 | $2,760 |
| 91335 | $796,055 | $2,564 |
| 90031 | $790,576 | $2,225 |
| 90032 | $788,351 | $2,477 |
| 90006 | $743,592 | $1,977 |
| 91303 | $742,575 | $2,509 |
| 91331 | $737,853 | Data not available |
| 91402 | $707,232 | $2,315 |
| 90062 | $691,369 | $2,533 |
| 90047 | $686,873 | $2,479 |
| 90020 | $682,155 | $1,948 |
| 90744 | $680,481 | $1,987 |
| 90037 | $659,082 | $2,529 |
| 90033 | $655,340 | $2,093 |
| 90044 | $642,078 | $2,341 |
| 90023 | $634,268 | $2,326 |
| 90061 | $626,538 | $2,519 |
| 90013 | $617,136 | $2,831 |
| 90015 | $609,517 | $2,641 |
| 90011 | $595,419 | $2,395 |
| 90012 | $593,929 | $2,429 |
| 90003 | $597,854 | $2,499 |
| 90002 | $588,042 | Data not available |
| 90058 | $583,213 | Data not available |
| 90017 | $576,743 | $2,668 |
| 90057 | $552,600 | $1,928 |
| 90014 | $534,334 | $2,532 |
Most Expensive Neighborhoods
90077 (Bel Air/Holmby Hills) tops the list at $3,020,999 — nearly three times the city median. Rents here average $12,311 per month, the highest in the city by a wide margin.
90272 (Pacific Palisades) comes in at $2,951,255 with rents of $7,601. This coastal enclave commands prices well above what most of LA’s west side fetches.
90049 (Brentwood) rounds out the top three at $2,921,418. Rents run $4,049 — relatively moderate compared to the home values, suggesting strong owner-occupant demand.
Most Affordable Neighborhoods
90014 (Downtown LA/Fashion District) is the city’s cheapest ZIP at $534,334 — roughly half the city median. Rents sit at $2,532, making this an area where buying is closer to parity with renting.
90057 (Westlake) follows at $552,600 with rents of just $1,928 — the lowest rent in the dataset. This is one of the few LA neighborhoods where housing costs are within reach of median-income households.
90017 (Downtown) comes in at $576,743. Despite low home values, rents are $2,668 — higher than many pricier neighborhoods, driven by newer apartment construction downtown.
Rent vs Buy in Los Angeles
Renting is the cheaper option on a monthly basis in nearly every Los Angeles neighborhood.
| Metric | Typical Cost |
|---|---|
| Median Home Value | $1,079,440 |
| 20% Down Payment | $215,888 |
| Loan Amount (80% LTV) | $863,552 |
| Est. Monthly Mortgage (6.5%, 30yr) | ~$5,460 |
| Typical Monthly Rent (mid-range ZIP) | $2,500 – $3,000 |
The gap is stark. Even in expensive ZIP codes like 90024 (Westwood), where rent averages $3,982, buying a $1.35M home would cost roughly $6,800 per month in principal and interest alone — before property taxes and insurance.
In more affordable areas, the math gets closer but still favors renting. Take 90014 (Downtown): a $534K home at 6.5% with 20% down runs about $2,700 per month, while rents there average $2,532. That’s a narrow gap of $168.
The rent-vs-buy equation shifts depending on how long you plan to stay. If you’re in LA for two to three years, renting makes financial sense almost everywhere. Over a decade, the equity build and potential appreciation tilt toward buying — if you can stomach the upfront cost.
One outlier worth noting: 90077 (Bel Air) rents at $12,311 per month. At that price point, a $3M mortgage payment and rent are roughly comparable, which is unusual for LA.
Population Growth and Migration
Los Angeles is shrinking — slowly.
| Year | Population |
|---|---|
| 2020 | 3,896,329 |
| 2021 | 3,830,987 |
| 2022 | 3,832,998 |
| 2023 | 3,847,428 |
| 2024 | 3,878,704 |
The city lost about 17,600 residents between 2020 and 2024, a 0.5% decline. The steepest drop hit in 2021, when roughly 65,000 people left. Since then, the population has been clawing back — gaining nearly 48,000 residents from 2021 to 2024.
That recovery hasn’t been enough to return to pre-pandemic levels. And compared to other California cities, LA is the outlier.
| City | 2024 Population | 4-Year Growth |
|---|---|---|
| Bakersfield | 417,468 | +3.0% |
| Sacramento | 535,798 | +1.9% |
| San Diego | 1,404,452 | +1.4% |
| Fresno | 550,105 | +1.4% |
| Stockton | 324,975 | +1.2% |
| Los Angeles | 3,878,704 | -0.5% |
Every major comparison city is growing. Bakersfield added residents at six times the rate LA lost them.
For the housing market, flat-to-declining population should theoretically ease demand. But LA’s housing shortage is structural — decades of underbuilding mean even a shrinking population hasn’t freed up much supply. The slight price decline of 0.9% YoY suggests demand is softening at the margins, not collapsing.
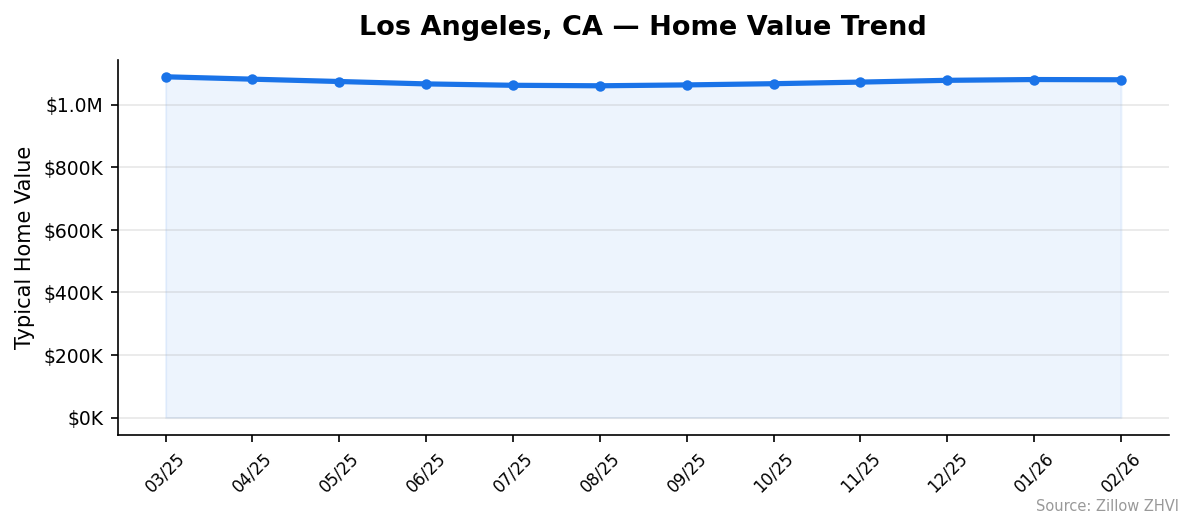
Los Angeles Housing Market Trends
| Month | Average Value | Low | High |
|---|---|---|---|
| Feb 2026 | $1,079,440 | $534,334 | $3,020,999 |
| Jan 2026 | $1,080,174 | $537,484 | $3,008,701 |
| Dec 2025 | $1,077,679 | $541,264 | $2,994,533 |
| Nov 2025 | $1,071,978 | $543,975 | $2,997,800 |
| Oct 2025 | $1,066,871 | $548,153 | $3,011,979 |
| Sep 2025 | $1,062,992 | $552,043 | $3,043,776 |
| Aug 2025 | $1,060,207 | $554,466 | $3,083,719 |
| Jul 2025 | $1,061,800 | $555,863 | $3,136,865 |
| Jun 2025 | $1,066,212 | $556,432 | $3,185,034 |
| May 2025 | $1,073,870 | $556,794 | $3,233,298 |
| Apr 2025 | $1,081,345 | $558,067 | $3,258,438 |
| Mar 2025 | $1,088,951 | $561,662 | $3,272,255 |
The 12-month chart tells two stories. At the top end, the most expensive ZIP codes lost value — dropping from $3.27M in March 2025 to $3.02M in February 2026, a 7.7% decline. Luxury properties are cooling faster than the rest of the market.
At the average level, prices dipped from $1,088,951 in March 2025 to a low of $1,060,207 in August 2025 — a 2.6% slide over five months. Then they reversed course, climbing $19,000 through February 2026.
Meanwhile, the cheapest neighborhoods held up better. The floor dropped only $27K from $561,662 to $534,334, a 4.9% decline. Affordable areas are losing value in dollar terms, but the percentage decline is modest.
The overall pattern: a mid-year dip followed by a slow recovery. Prices haven’t returned to March 2025 levels, and the year-over-year number remains negative.
Is Los Angeles a Good Place to Buy in 2026?
The data points in different directions depending on what you prioritize.
Reasons to consider buying: Prices are 0.9% below where they were a year ago — the first real dip in years. The August-to-February uptrend suggests the market has found a floor. If you’ve been waiting for a correction, this might be as much of one as LA delivers.
Reasons to wait: Monthly mortgage costs dwarf rents in most neighborhoods. A $5,400+ monthly payment for a median home is steep, even by California standards. Population is flat, which doesn’t support aggressive price growth.
The neighborhood factor matters more than citywide numbers. A $534K home in 90014 and a $3M home in 90077 are in fundamentally different markets with different risk profiles. Affordable ZIPs in South LA and the San Fernando Valley offer the best entry points, while luxury areas face the sharpest corrections.
If you plan to stay at least seven to ten years and can handle the monthly cost, current conditions are more favorable than anything in the last three years. Short-term buyers face significant risk that prices stay flat or dip further.
Los Angeles Housing Market Outlook for 2026-2027
The six-month trend from August 2025 through February 2026 shows a steady but slow recovery — prices rose about $19,000, or 1.8%, over that stretch. If the current pace continues, average values could push back above $1,090,000 by mid-2026.
But the recovery is losing steam. The month-over-month gain from January to February 2026 was essentially flat — a $734 decline. That stalling could signal the beginning of a plateau rather than continued upward movement.
The top end of the market tells a different story. High-end ZIPs have shed value for twelve straight months. The 3-month trend suggests luxury prices haven’t bottomed yet.
For the broader market, expect sideways movement through the rest of 2026. The data doesn’t support a sharp move in either direction. Prices are likely to hover within $20,000 of the current $1,079,440 median absent a major shift in interest rates or inventory.
Similar Markets in CA
If you’re exploring alternatives to Los Angeles, several California cities offer different price points.
- Long Beach — A neighboring city in the same metro area, often $200K–$400K below LA’s median for comparable neighborhoods.
- San Diego — Growing at 1.4% with a population of 1.4 million, San Diego offers coastal living with a different market profile.
- Riverside — Inland Empire pricing runs well below LA’s, making it a common choice for buyers priced out of the basin.
- Anaheim — Part of the same metro area but in Orange County, with its own price dynamics.
- San Francisco — For buyers who think LA is expensive, San Francisco offers perspective on just how high California prices can go.
Frequently Asked Questions
What is the average home price in Los Angeles?
The average home price in Los Angeles is $1,079,440 as of February 2026. This figure represents the Zillow Home Value Index, which measures typical home values in the 35th to 65th percentile range. Prices across the city’s 97 tracked ZIP codes range from $534,334 to $3,020,999.
Are home prices going up or down in Los Angeles?
Home prices in Los Angeles are down 0.9% compared to a year ago. Prices hit their 12-month low in August 2025 at $1,060,207, then recovered through early 2026. The overall trend is slightly negative year-over-year, but the recent months show stabilization.
Is it cheaper to rent or buy in Los Angeles?
Renting is cheaper in nearly every neighborhood. A mortgage on the median-priced home runs approximately $5,460 per month (assuming 20% down at 6.5%), while typical rents in mid-range ZIP codes fall between $2,500 and $3,000. The gap narrows in the most affordable areas like 90014, where the monthly mortgage and rent are within a few hundred dollars of each other.
What is the most affordable neighborhood in Los Angeles?
ZIP code 90014 in Downtown LA has the lowest median home value at $534,334. The nearby 90057 (Westlake) at $552,600 and 90017 (Downtown) at $576,743 are also among the most affordable. These areas offer prices roughly half the citywide median.
Is Los Angeles growing or shrinking?
Los Angeles is slightly shrinking. The city’s population declined 0.5% from 3,896,329 in 2020 to 3,878,704 in 2024. The steepest drop came in 2021, but the population has been recovering since — gaining about 48,000 residents between 2021 and 2024 without fully returning to 2020 levels.
Methodology
Home values are based on the Zillow Home Value Index (ZHVI), a smoothed measure of typical home values in the 35th to 65th percentile range. Rent estimates use the Zillow Observed Rent Index (ZORI). Population figures come from the U.S. Census Bureau Population Estimates Program (2020-2024 vintage). All datasets are publicly available. Housing data updated 2026-02-28.