San Francisco Home Prices: $1.31M, Up 4.1% — 26 ZIPs Analyzed (2026)
$1,310,721. That’s what a typical home costs in San Francisco as of February 2026. Prices are up 4.1% from a year ago, and the upward trend has accelerated over the past six months. If you’re watching this market, here’s what the numbers actually say.
Quick answer: The average home price in San Francisco, CA is $1,310,721 as of February 2026, up 4.1% year over year according to Zillow.
Current Home Prices in San Francisco
| Metric | Value |
|---|---|
| Median Home Value | $1,310,721 |
| Year-over-Year Change | +4.1% |
| Lowest ZIP Code Value | $698,979 |
| Highest ZIP Code Value | $2,219,457 |
| Number of ZIP Codes Tracked | 26 |
| Data as of | February 2026 |
San Francisco remains one of the most expensive housing markets in the country. The citywide median sits above $1.3 million, meaning even the “average” home here is well beyond reach for most American households.
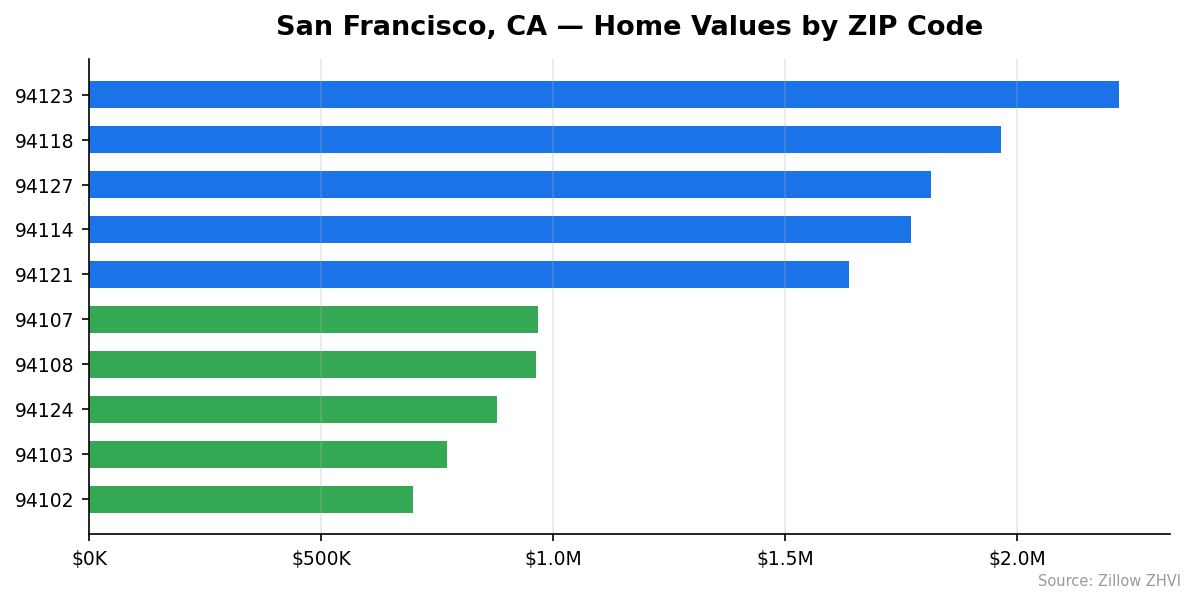
The price gap across neighborhoods is enormous. The cheapest ZIP code comes in under $700,000, while the most expensive tops $2.2 million. That’s a 3x spread within a single city of just 47 square miles.
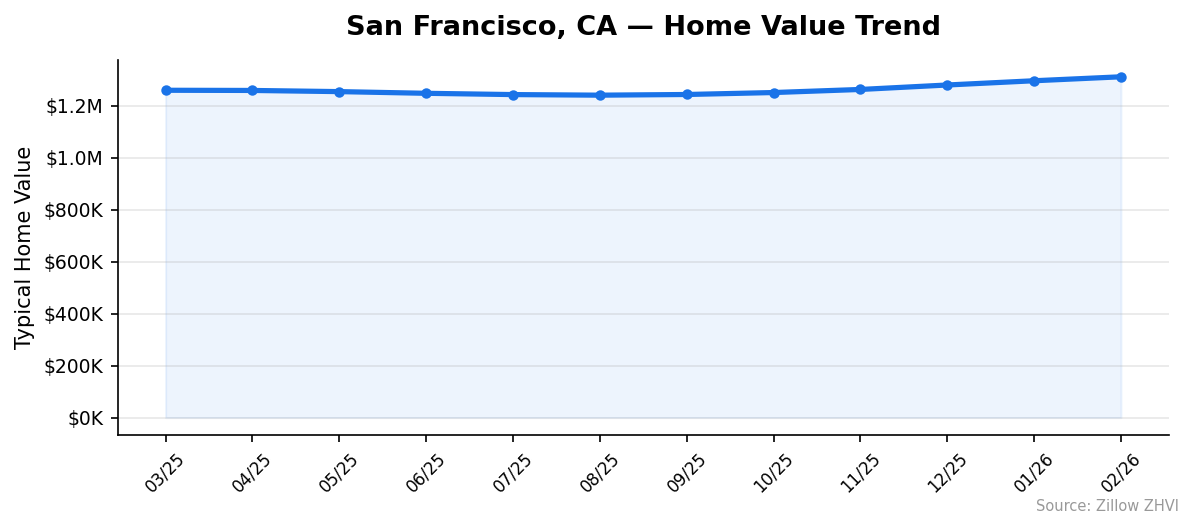
Year-over-year growth of 4.1% signals a market that’s regained momentum. Prices dipped through much of mid-2025 before reversing course in the fall. The current uptrend has now held for six consecutive months.
San Francisco Home Prices by Neighborhood
| ZIP Code | Median Home Value | Typical Monthly Rent |
|---|---|---|
| 94102 | $698,979 | $3,049 |
| 94103 | $770,971 | $3,829 |
| 94104 | $1,083,414 | — |
| 94105 | $1,050,002 | $4,694 |
| 94107 | $967,797 | $4,061 |
| 94108 | $962,185 | $2,957 |
| 94109 | $989,235 | $3,030 |
| 94110 | $1,274,551 | $4,043 |
| 94111 | $1,048,531 | — |
| 94112 | $1,084,067 | $3,226 |
| 94114 | $1,770,781 | $4,143 |
| 94115 | $1,377,994 | $3,644 |
| 94116 | $1,483,340 | $3,364 |
| 94117 | $1,488,311 | $3,901 |
| 94118 | $1,965,159 | $3,683 |
| 94121 | $1,638,889 | $3,366 |
| 94122 | $1,548,359 | $3,341 |
| 94123 | $2,219,457 | $4,005 |
| 94124 | $880,033 | $3,718 |
| 94127 | $1,815,800 | — |
| 94129 | $1,529,342 | $4,675 |
| 94131 | $1,580,172 | $4,079 |
| 94132 | $1,292,344 | $4,277 |
| 94133 | $1,288,212 | $4,265 |
| 94134 | $1,026,991 | $3,811 |
| 94158 | $1,243,823 | $4,743 |
Most Expensive ZIP Codes
94123 — $2,219,457. The Marina District tops the chart at nearly $2.2 million, almost 70% above the city median. Rents here run $4,005 per month.
94118 — $1,965,159. The Inner Richmond comes in second at just under $2 million. Despite the high home values, rents are moderate at $3,683, making the price-to-rent ratio especially steep.
94127 — $1,815,800. West Portal/St. Francis Wood rounds out the top three. Rent data is not available for this ZIP.
Most Affordable ZIP Codes
94102 — $698,979. The Tenderloin and Civic Center area is the only ZIP below $700,000. Rents here are $3,049 per month — among the lowest in the city but still substantial.
94103 — $770,971. SoMa’s southern portion offers the second-lowest home values at $770,971, with rents of $3,829.
94124 — $880,033. Bayview-Hunters Point comes in third at $880,033. Rents are $3,718, which is actually higher than many pricier neighborhoods — a sign of high rental demand relative to home prices.
Rent vs Buy in San Francisco
Renting is far cheaper than buying on a monthly basis.
| Metric | Cost |
|---|---|
| Citywide Median Rent (typical) | $3,700–$3,900/mo |
| Lowest Rent (94108) | $2,957/mo |
| Highest Rent (94158) | $4,743/mo |
| Estimated Mortgage on Median Home (20% down, 7%) | ~$6,975/mo |
| Estimated Total Housing Cost (taxes, insurance) | ~$8,500+/mo |
A buyer putting 20% down on the median $1.31 million home takes on a $1.05 million mortgage. At a 7% rate, that’s roughly $6,975 per month in principal and interest alone. Add property taxes and insurance, and the total monthly cost exceeds $8,500.
Meanwhile, typical rents across the city range from about $2,957 to $4,743 per month. The math favors renting by a wide margin in terms of monthly cash flow.
That said, rent money builds zero equity. Buyers are paying a premium to own an asset that has historically appreciated in San Francisco. Over the last 12 months, the median home gained roughly $51,000 in value — about $4,250 per month in paper wealth.
Whether renting or buying makes more sense depends on how long you plan to stay and whether you can handle the upfront costs. For short-term residents, renting wins. For those staying 7+ years with a down payment ready, the math shifts.
Population Growth and Migration
San Francisco is losing residents. The city’s population dropped 5.4% between 2020 and 2024.
| Year | Population |
|---|---|
| 2020 | 874,826 |
| 2021 | 815,498 |
| 2022 | 814,176 |
| 2023 | 819,151 |
| 2024 | 827,526 |
The sharpest decline hit in 2021, when the city shed nearly 60,000 residents in a single year. That exodus slowed by 2022, and the population has ticked up slightly since — gaining about 13,000 people between 2022 and 2024.
Still, San Francisco sits 47,300 below its 2020 peak. The recovery is real but incomplete.
Compare that to other California cities:
| City | 2024 Population | 4-Year Growth |
|---|---|---|
| San Diego | 1,404,452 | +1.4% |
| Fresno | 550,105 | +1.4% |
| Sacramento | 535,798 | +1.9% |
| Bakersfield | 417,468 | +3.0% |
| Stockton | 324,975 | +1.2% |
Every major comparison city in California grew during the same period that San Francisco shrank. Bakersfield led the pack at 3.0% growth.
For the housing market, population loss should theoretically relieve demand. But prices are still rising, which suggests the people staying — and arriving — have higher purchasing power than those who left. Remote work reshuffled the income distribution, not just the headcount.
San Francisco Housing Market Trends
| Month | Median Home Value | Month-over-Month Change |
|---|---|---|
| Mar 2025 | $1,258,892 | — |
| Apr 2025 | $1,258,181 | -0.1% |
| May 2025 | $1,253,696 | -0.4% |
| Jun 2025 | $1,247,215 | -0.5% |
| Jul 2025 | $1,242,295 | -0.4% |
| Aug 2025 | $1,240,018 | -0.2% |
| Sep 2025 | $1,242,626 | +0.2% |
| Oct 2025 | $1,250,134 | +0.6% |
| Nov 2025 | $1,261,985 | +0.9% |
| Dec 2025 | $1,279,141 | +1.4% |
| Jan 2026 | $1,295,471 | +1.3% |
| Feb 2026 | $1,310,721 | +1.2% |
The 12-month trend tells a clear story in two acts.
Act one: the dip. From March through August 2025, prices slid for five consecutive months. The decline was shallow — just 1.5% peak to trough — but it marked the only sustained pullback in the data window.
Act two: the rebound. Starting in September 2025, prices reversed and haven’t looked back. The gains accelerated from 0.2% in September to 1.4% in December before settling into a steady 1.2–1.3% monthly pace through early 2026.
Over the full 12-month span, prices climbed from $1,258,892 to $1,310,721 — a net gain of $51,829 or about 4.1%.
Is San Francisco a Good Place to Buy in 2026?
The data points to a seller’s market that’s gaining strength.
Prices have risen for six straight months with accelerating momentum. The year-over-year gain of 4.1% outpaces inflation. And the mid-2025 dip proved to be a brief pause, not the start of a correction.
For buyers, the challenge is straightforward: the median home costs $1.31 million. Even with 20% down, you need roughly $262,000 in cash and a household income north of $250,000 to qualify for the mortgage. That prices out the vast majority of households.
The population decline might seem like a silver lining, but it hasn’t translated into lower prices. If anything, it’s made the market more competitive at the high end.
If you can afford to buy and plan to hold the property for at least five to seven years, the data supports entering the market. Waiting has historically been more expensive than buying in San Francisco. But if you’re stretching to afford it, the rent-vs-buy math suggests patience.
San Francisco Housing Market Outlook for 2026-2027
The three-month trend suggests continued price increases through mid-2026. Monthly gains of 1.2–1.4% have held steady from December through February, showing no signs of slowing.
If the current pace continues, median values could approach $1.35–$1.38 million by summer 2026. That would represent a roughly 8–10% annualized rate — hotter than the trailing 12-month average.
Whether that pace holds depends on factors outside this data set: mortgage rates, tech sector hiring, and inventory levels. The momentum is clearly upward, but sustained 1%+ monthly gains are historically unusual and often moderate.
The mid-2025 dip is worth remembering. San Francisco’s market tends to soften in summer months. A seasonal slowdown later in 2026 wouldn’t be surprising, though the baseline has shifted higher.
Similar Markets in CA
If you’re exploring the California housing market beyond San Francisco, consider these cities:
- Los Angeles — The state’s largest city offers more inventory and neighborhood variety at a lower median than San Francisco.
- San Diego — Strong population growth of 1.4% and a coastal lifestyle at a lower price point.
- Long Beach — A more affordable alternative in the greater LA area with port city character.
- Fresno — Central Valley buyers find dramatically lower prices with 1.4% population growth.
- Bakersfield — The fastest-growing comparison city at 3.0%, with prices well below the Bay Area.
Frequently Asked Questions
What is the average home price in San Francisco?
The average home price in San Francisco is $1,310,721 as of February 2026. This figure represents the Zillow Home Value Index, which tracks typical home values in the 35th to 65th percentile range. Prices range from $698,979 in the most affordable ZIP code to $2,219,457 in the priciest.
Are home prices going up or down in San Francisco?
Prices are going up. San Francisco home values increased 4.1% year over year. After a mild dip from March through August 2025, prices have risen for six consecutive months with monthly gains between 0.2% and 1.4%.
Is it cheaper to rent or buy in San Francisco?
Renting is significantly cheaper on a monthly basis. Typical rents range from $2,957 to $4,743 per month, while a mortgage on the median home runs roughly $8,500+ per month including taxes and insurance. The gap is approximately $4,000–$5,000 per month in favor of renting.
What is the most affordable neighborhood in San Francisco?
ZIP code 94102, covering the Tenderloin and Civic Center area, is the most affordable at $698,979. That’s roughly half the citywide median of $1.31 million. The next most affordable are 94103 (SoMa) at $770,971 and 94124 (Bayview) at $880,033.
Is San Francisco growing or shrinking?
San Francisco is shrinking. The city lost 5.4% of its population between 2020 and 2024, dropping from 874,826 to 827,526. The sharpest decline came in 2021, though the population has partially recovered since 2022, adding back about 13,000 residents over two years.
Methodology
Home values are based on the Zillow Home Value Index (ZHVI), a smoothed measure of typical home values in the 35th to 65th percentile range. Rent estimates use the Zillow Observed Rent Index (ZORI). Population figures come from the U.S. Census Bureau Population Estimates Program (2020-2024 vintage). All datasets are publicly available. Housing data updated 2026-02-28.