Quincy Home Prices: $684K, Up 0.5% — 3 ZIPs Analyzed (2026)
$684K. That’s what a typical home costs in Quincy, Massachusetts — a city of 103,000 sitting just south of Boston. Prices inched up 0.5% over the past year, a near-flat reading that masks a more interesting story in the monthly data. Quincy actually lost value through much of 2025 before reversing course in the fall.
Quick answer: The average home price in Quincy, MA is $683,819 as of February 2026, up 0.5% year over year according to Zillow.
Current Home Prices in Quincy
Here’s where Quincy stands right now:
| Metric | Value |
|---|---|
| Median Home Value | $683,819 |
| Year-over-Year Change | +0.5% |
| Lowest ZIP Median | $619,809 |
| Highest ZIP Median | $736,208 |
| Price Spread | $116,399 |
| Number of ZIPs Tracked | 3 |
That 0.5% annual gain barely keeps pace with inflation. For context, the spread between Quincy’s cheapest and most expensive ZIP codes is $116,399 — about 17% of the median. That’s a relatively tight range for a city this close to a major metro core.
The Boston-Cambridge-Newton metro area drives much of Quincy’s pricing. Buyers priced out of Boston proper often look south, and Quincy sits on the Red Line with direct subway access to downtown. That transit connection keeps a floor under prices even when the broader market softens.
If you bought a home at the city median a year ago, your equity gain would be roughly $3,400. Not a windfall, but not a loss either.
Quincy Home Prices by Neighborhood
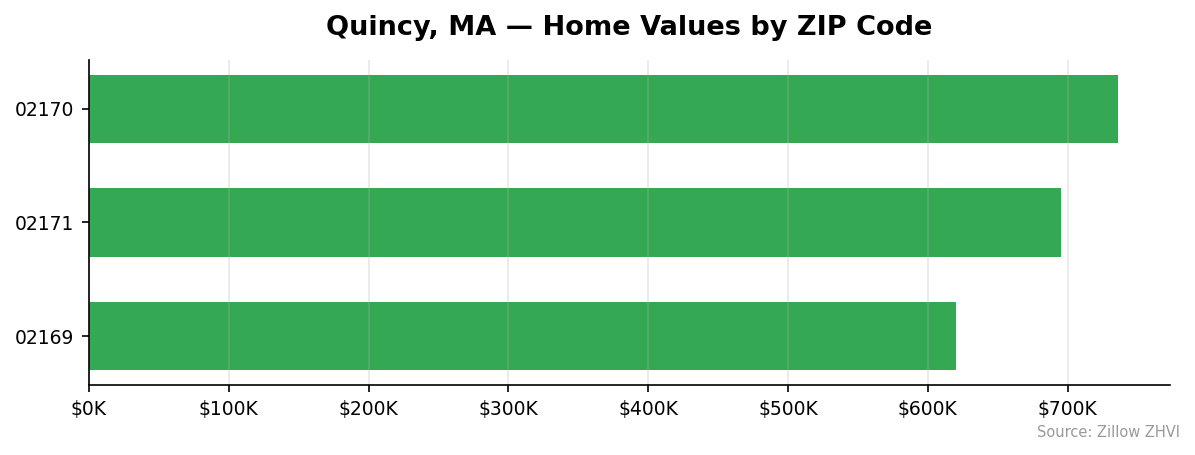
All three Quincy ZIP codes tracked by Zillow show values above $600K:
| ZIP Code | Median Home Value | Monthly Rent |
|---|---|---|
| 02169 | $619,809 | $2,643 |
| 02170 | $736,208 | $2,338 |
| 02171 | $695,440 | $2,790 |
Most Expensive
02170 tops the list at $736,208, sitting $52,389 above the city average — yet it has the lowest rent of all three ZIPs at $2,338/month, which may reflect a different housing mix with more owner-occupied single-family homes.
Most Affordable
02169 comes in at $619,809, roughly $64,000 below the city median. Despite the lower home values, rent here runs $2,643/month — higher than the priciest ZIP. That gap between home price and rent suggests 02169 may offer better value for investors looking at rental yield.
The rent-to-price relationship in Quincy is unusual. The cheapest ZIP to buy has the second-highest rent, and the most expensive ZIP to buy has the lowest rent. If you’re weighing where to invest, the numbers reward a closer look at 02169.
Rent vs Buy in Quincy
Average rent across Quincy’s three ZIP codes runs about $2,590/month.
Here’s a rough monthly cost comparison for buying at the city median of $683,819:
| Scenario | Monthly Cost |
|---|---|
| Average Rent | $2,590 |
| Mortgage (20% down, 6.5% rate) | ~$3,460 |
| Mortgage (10% down, 7% rate) | ~$4,100 |
| Mortgage + taxes + insurance (est.) | ~$4,500-$5,200 |
Buying costs $900 to $2,600 more per month than renting, depending on your down payment and rate. That’s a wide gap. You’d need to bet on long-term appreciation or have other reasons — stability, tax benefits, building equity — to justify the premium right now.
At 0.5% annual appreciation, the math favors renting in the short term. But if you plan to stay five or more years and rates drop, the calculus changes.
One thing to note: rent in 02171 hits $2,790/month. At that level, the gap between renting and buying narrows enough to make ownership more competitive in that specific ZIP.
Population Growth and Migration
Quincy’s population hit 103,434 in 2024, up 1.9% from 101,492 in 2020.
| Year | Population |
|---|---|
| 2020 | 101,492 |
| 2021 | 101,144 |
| 2022 | 102,249 |
| 2023 | 102,304 |
| 2024 | 103,434 |
The city dipped slightly in 2021 — a pattern seen across many urban areas during the pandemic — then recovered and added residents each year since. The 2024 jump of 1,130 people was the largest single-year gain in this window.
How does Quincy compare to other Massachusetts cities?
| City | 2024 Population | 4-Year Growth |
|---|---|---|
| Worcester | 211,286 | 4.4% |
| Lowell | 120,418 | 4.0% |
| Cambridge | 121,186 | 2.5% |
| Lynn | 103,489 | 2.4% |
| Quincy | 103,434 | 1.9% |
| Newton | 90,700 | 2.1% |
Quincy’s 1.9% growth trails most of its peers. Worcester and Lowell are growing more than twice as fast. Lynn, nearly identical in population size at 103,489, is growing at 2.4%.
Steady but modest population growth supports housing demand without creating the kind of pressure that drives rapid price spikes. For buyers, that’s actually a decent sign — it means demand isn’t overheating.
Quincy Housing Market Trends
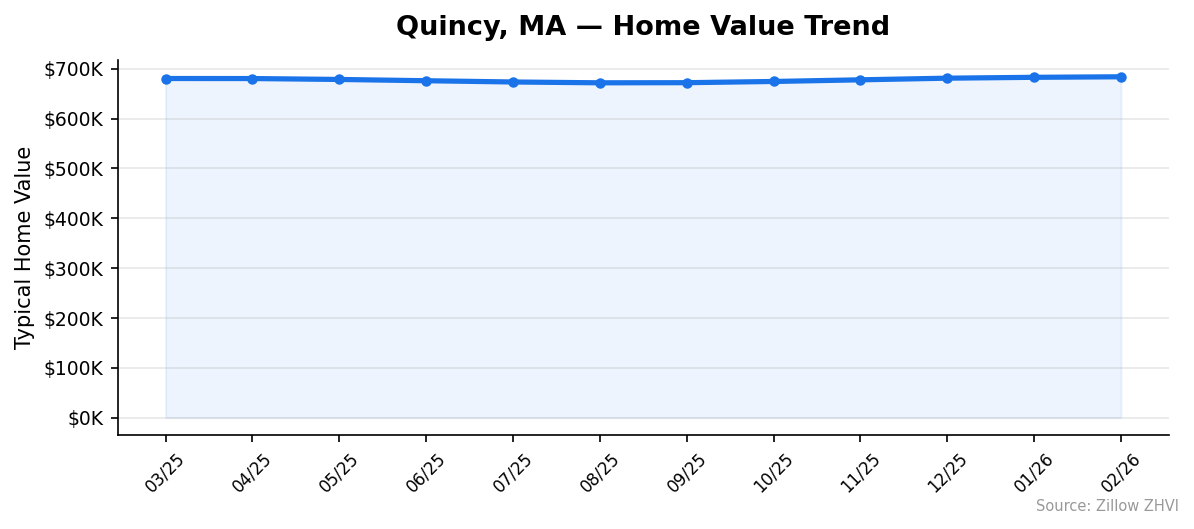
The 12-month price trend tells a story of decline, bottoming, and recovery:
| Month | Average Value | Low | High |
|---|---|---|---|
| Mar 2025 | $680,380 | $616,383 | $731,518 |
| Apr 2025 | $680,297 | $616,010 | $732,365 |
| May 2025 | $678,468 | $614,060 | $731,393 |
| Jun 2025 | $675,917 | $611,764 | $729,258 |
| Jul 2025 | $673,394 | $609,775 | $726,331 |
| Aug 2025 | $671,749 | $608,790 | $724,033 |
| Sep 2025 | $671,978 | $609,409 | $723,633 |
| Oct 2025 | $674,428 | $611,543 | $726,023 |
| Nov 2025 | $677,733 | $614,286 | $729,618 |
| Dec 2025 | $681,024 | $617,052 | $733,215 |
| Jan 2026 | $682,771 | $618,719 | $735,116 |
| Feb 2026 | $683,819 | $619,809 | $736,208 |
Prices dropped from $680,380 in March 2025 to a low of $671,749 in August — a decline of about $8,600 or 1.3%. Then the trend reversed. From August through February, values climbed $12,070, recovering all the lost ground and then some.
The bottom-to-top range over 12 months was roughly $14,500. Not wild swings, but enough to matter if you’re timing a purchase. Buyers who acted in August or September got the best deal in this cycle.
Is Quincy a Good Place to Buy in 2026?
The data points to a balanced market leaning slightly toward sellers. Here’s why:
Prices are rising, but barely. A 0.5% annual gain gives sellers a slight edge in negotiations, but it’s not the kind of market where bidding wars dominate. You have room to negotiate.
The rent-to-own gap is wide. If you’re currently renting at $2,590 and can wait, there’s no financial urgency to buy. But if you’re already paying $2,790 in 02171, ownership starts to make more sense.
Population is growing. A city adding roughly 1,000 residents per year in a supply-constrained state like Massachusetts won’t see prices collapse. The floor is solid.
For first-time buyers, 02169 at $619,809 is the entry point. It’s still expensive by national standards, but it’s the most accessible door into Quincy’s market. For investors, that same ZIP’s combination of lower prices and higher rents ($2,643/month) deserves serious analysis.
Quincy Housing Market Outlook for 2026-2027
The five-month upward streak from September 2025 through February 2026 shows consistent momentum. Each month added roughly $2,000-$3,000 to the city median.
If the current pace continues, Quincy could reach $690,000-$695,000 by mid-2026. That’s not a bold prediction — it’s just extending the existing trendline forward.
The 2025 pattern — spring softness followed by fall recovery — may repeat. If it does, buyers who wait until late summer could find a small window of better prices before the fall uptick resumes.
Nothing in the data suggests a sharp move in either direction. This is a market grinding higher, not surging. Plan accordingly.
Similar Markets in MA
If you’re shopping in the Boston metro, these Massachusetts cities are worth comparing:
- Boston — The obvious neighbor, likely pricier but with more inventory to choose from.
- Cambridge — Growing at 2.5% with strong transit access, similar buyer profile to Quincy.
- Lynn — Nearly the same population as Quincy and growing faster at 2.4%, potentially at a lower price point.
- Worcester — The fastest-growing city on this list at 4.4%, further from Boston but significantly more affordable.
- Brookline — Another inner suburb worth benchmarking against Quincy’s prices.
Frequently Asked Questions
What is the average home price in Quincy?
The average home price in Quincy, MA is $683,819 as of February 2026. That figure represents the Zillow Home Value Index across all three tracked ZIP codes. Prices range from $619,809 in 02169 to $736,208 in 02170.
Are home prices going up or down in Quincy?
Prices are up 0.5% year over year. The monthly data shows a mid-2025 dip followed by five straight months of gains. The low point was August 2025 at $671,749, and prices have climbed $12,070 since then.
Is it cheaper to rent or buy in Quincy?
Renting is cheaper on a monthly basis. Average rent across Quincy runs about $2,590/month, while a mortgage payment on the median-priced home would be $3,460 to $4,100+ depending on your down payment and interest rate. Add property taxes and insurance, and the gap widens further.
What is the most affordable neighborhood in Quincy?
ZIP code 02169 has the lowest median home value at $619,809 — about $64,000 below the city average. It also has relatively high rents at $2,643/month, making it the most interesting ZIP for both budget-conscious buyers and rental investors.
Methodology
Home values are based on the Zillow Home Value Index (ZHVI), a smoothed measure of typical home values in the 35th to 65th percentile range. Rent estimates use the Zillow Observed Rent Index (ZORI). Population figures come from the U.S. Census Bureau Population Estimates Program (2020-2024 vintage). All datasets are publicly available. Housing data updated 2026-02-28.