Worcester Home Prices: $396K, Up 1.6% — 9 ZIPs Analyzed (2026)
$395,700. That’s the typical home value in Worcester right now, and it’s 1.6% higher than a year ago. Prices have climbed in eight of the past twelve months.
Quick answer: The average home price in Worcester, MA is $395,700 as of February 2026, up 1.6% year over year according to Zillow.
Current Home Prices in Worcester
The Worcester market sits in the middle of Massachusetts price tiers — well below Boston metro, well above Springfield. Across the nine ZIP codes tracked here, the typical home value spans a wide range.
| Metric | Value |
|---|---|
| Median home value | $395,700 |
| Year-over-year change | +1.6% |
| Cheapest ZIP | $189,397 (01608) |
| Most expensive ZIP | $531,728 (01609) |
| ZIP codes tracked | 9 |
| Data through | February 2026 |
| Metro area | Worcester, MA-CT |
The spread between the cheapest and most expensive ZIP is more than $342,000. That’s a 2.8x ratio — meaning the priciest neighborhood costs nearly three times what the cheapest one does. For a city of just over 211,000 people, that’s a meaningful gap.
The 1.6% annual gain is modest. It trails inflation in most months over the past year, which means real (inflation-adjusted) prices are roughly flat or slightly down. Buyers waiting for a crash haven’t gotten one. Sellers expecting double-digit appreciation haven’t gotten that either.
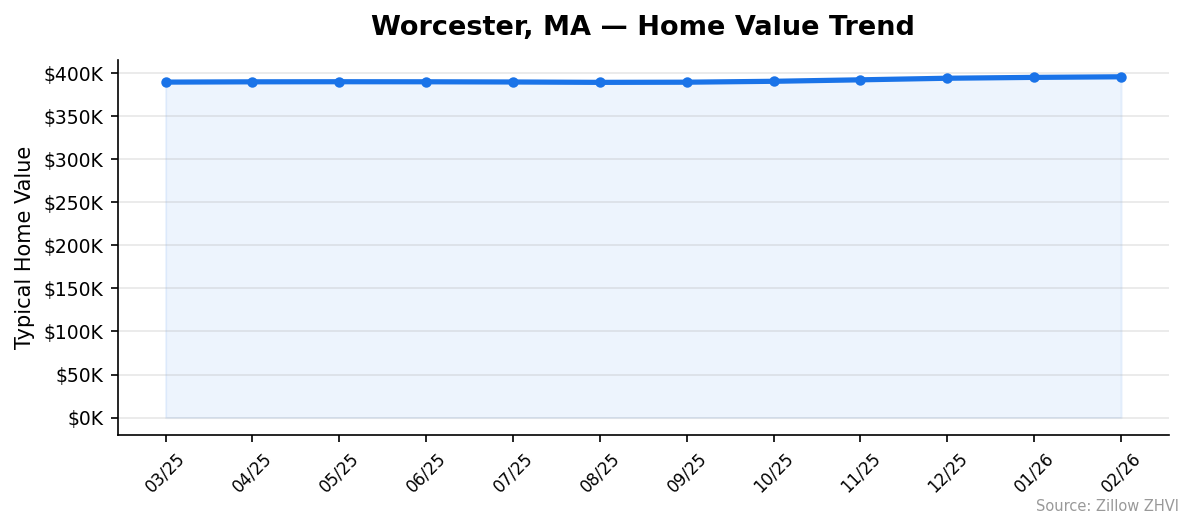
What you’re looking at is a market that has settled. After the post-2020 run-up, Worcester prices stopped climbing aggressively in mid-2025 and have only inched higher since. Between July 2025 and February 2026 — eight months — the median rose from $389,664 to $395,700. That works out to about $750 per month in appreciation on the typical home.
Worcester Home Prices by Neighborhood
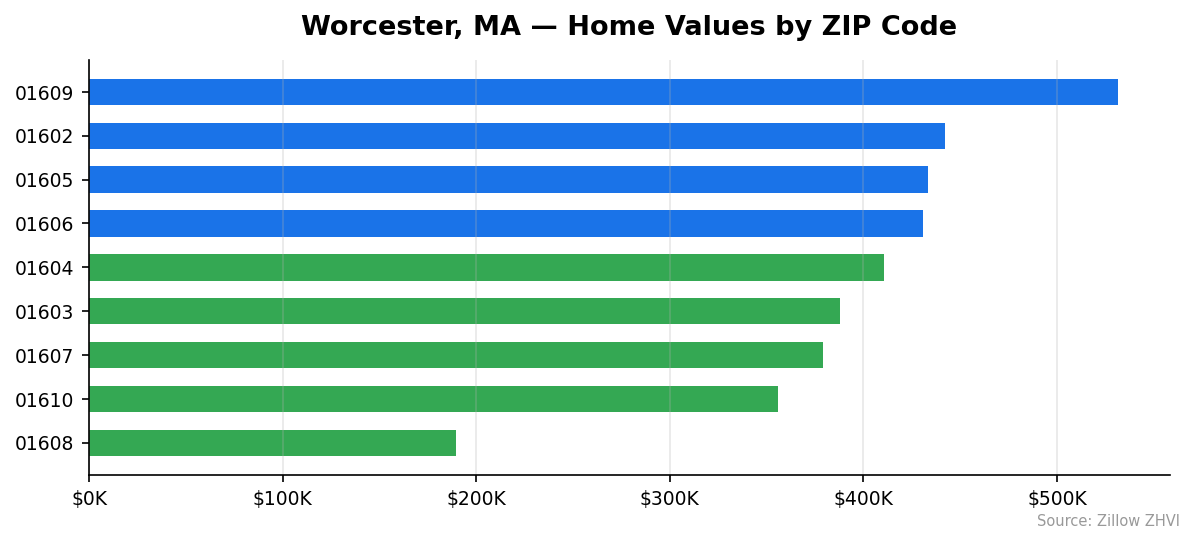
Nine ZIP codes split the city. Their typical home values vary more than most outsiders expect.
| ZIP | Typical Home Value | Avg Rent |
|---|---|---|
| 01609 | $531,728 | $1,858 |
| 01602 | $442,335 | $2,488 |
| 01605 | $433,432 | $2,311 |
| 01606 | $431,012 | $2,238 |
| 01604 | $410,534 | $2,207 |
| 01603 | $387,804 | $2,102 |
| 01607 | $379,053 | $1,921 |
| 01610 | $356,001 | $2,109 |
| 01608 | $189,397 | $1,928 |
Most Expensive
- 01609 at $531,728 — the West Side and Tatnuck area, roughly 34% above the city median. Notably, rent is the lowest of any ZIP at $1,858, suggesting owner-occupied single-family stock dominates here.
- 01602 at $442,335 — also western Worcester, with the highest rents in the city ($2,488), pointing to a mix of rental and owner properties.
- 01605 at $433,432 — Greendale and Burncoat to the north, priced about 9.5% above the citywide median.
Most Affordable
- 01608 at $189,397 — downtown Worcester. Less than half the city median, and rent here ($1,928) is actually higher than the most expensive ZIP’s rent. That’s the condo-and-loft signal.
- 01610 at $356,001 — the South Worcester and College Hill area near Clark University, about 10% below median.
- 01607 at $379,053 — Quinsigamond Village, close to median but with the second-lowest rents at $1,921.
Rent vs Buy in Worcester
The average rent across all nine ZIPs is about $2,129 per month. For a typical Worcester home at $395,700, here’s the math.
| Cost | Monthly |
|---|---|
| Average rent | $2,129 |
| Mortgage P&I (20% down, 7%, 30 yr) | $2,106 |
| Property tax (~1.2% MA avg) | $396 |
| Insurance estimate | $150 |
| Total ownership cost | $2,652 |
Renting wins by about $520 per month right now. That’s roughly $6,300 a year you’d save by renting — though renters don’t build equity.
The rent-to-buy gap closes if you put more down, get a lower rate, or stay long enough for principal paydown to matter. For a five-year buyer with no plans to stay, renting is the clearer win in this market. For a ten-year buyer, the math flips once you factor in tax deductions and the ~$13,000 in equity you’d build over five years even at slow appreciation.
One quirk: ZIP 01608’s rent ($1,928) is higher than its home value implies, which often means buying makes more sense in downtown condos than the citywide math suggests.
Population Growth and Migration
Worcester is growing, and faster than most of its peer cities in Massachusetts.
| Year | Population |
|---|---|
| 2020 | 202,475 |
| 2021 | 205,656 |
| 2022 | 206,602 |
| 2023 | 209,211 |
| 2024 | 211,286 |
That’s 4.4% growth over four years — about 8,800 new residents. Worcester gained population every single year since 2020.
Compare that to other Massachusetts cities:
| City | 2024 Population | 4-Yr Growth |
|---|---|---|
| Worcester | 211,286 | +4.4% |
| Lowell | 120,418 | +4.0% |
| Cambridge | 121,186 | +2.5% |
| Lynn | 103,489 | +2.4% |
| Newton | 90,700 | +2.1% |
| Quincy | 103,434 | +1.9% |
Worcester leads this group on growth rate. Cambridge and Newton, despite stronger national name recognition, are growing at half Worcester’s pace. That matters for housing demand. More people means more pressure on supply, and Worcester’s modest 1.6% price appreciation suggests new construction is keeping reasonable pace — for now.
If population growth continues at the 2020-2024 rate, Worcester would add another 9,000 residents by 2028. That’s demand for roughly 3,500 to 4,000 housing units depending on household size assumptions.
Worcester Housing Market Trends
The 12-month trajectory shows steady, slow climbing.
| Month | Median Value |
|---|---|
| March 2025 | $389,521 |
| April 2025 | $389,856 |
| May 2025 | $389,963 |
| June 2025 | $389,903 |
| July 2025 | $389,664 |
| August 2025 | $389,224 |
| September 2025 | $389,421 |
| October 2025 | $390,470 |
| November 2025 | $392,178 |
| December 2025 | $394,014 |
| January 2026 | $395,015 |
| February 2026 | $395,700 |
Prices moved sideways from March through September 2025 — a six-month flat patch where the median barely budged from the $389K range. Then from October onward, momentum picked up. The market added roughly $6,000 to the median in the most recent four months alone.
The bottom of the range (cheapest ZIP) climbed from $181,450 in March 2025 to $189,397 by February 2026 — a 4.4% gain. That’s higher than the citywide 1.6% number, suggesting the affordable end is appreciating faster than the top end.
Is Worcester a Good Place to Buy in 2026?
The data points to a balanced market, leaning slightly toward sellers.
Prices are up 1.6% over twelve months — not a buyer’s market crash, not a seller’s market frenzy. Population growth of 4.4% over four years gives demand a steady floor. The wide ZIP spread ($189K to $532K) means buyers at almost any budget have options, which isn’t true in pricier Massachusetts metros.
For a buyer with a 5+ year horizon, the math works. Renting saves about $520 a month, but five years of 1.6% annual appreciation on a $395,700 home builds roughly $33,000 in price gain plus loan principal paydown. That comfortably exceeds the $31,200 in rent savings over the same period.
For investors, the rent-to-price ratio is mediocre. A $395,700 home renting for $2,129 generates 6.5% gross yield before expenses — workable but not exciting. The downtown ZIP 01608 looks more interesting on rent yield: $1,928 on a $189,397 home is 12.2% gross.
If you’re flipping in under two years, prices aren’t moving fast enough to make sense.
Worcester Housing Market Outlook for 2026-2027
The 3-month trend is the clearest signal. From November 2025 to February 2026, the median rose from $392,178 to $395,700 — about $1,175 per month, or roughly 0.3% monthly.
If the current pace continues, Worcester would cross $400,000 by mid-2026 and approach $410,000 by year-end 2026. That’s not a forecast — it’s just the math of extending the recent run.
The slower 12-month pace (1.6%) suggests the recent acceleration may not hold. Markets that climb fast for a quarter or two often plateau again. The mid-2025 flat patch shows Worcester is capable of pausing.
What to watch: whether the cheapest ZIPs keep outpacing the city average. If the affordable end keeps appreciating faster than the top, the price spread compresses — and that usually marks a market that’s pricing in stronger demand from first-time buyers.
Similar Markets in MA
- Quincy — closer to Boston, generally higher priced than Worcester for similar housing types.
- Lowell — another mid-size MA city with comparable population growth (4.0%) and a similar middle-tier price profile.
- Springfield — west of Worcester, historically a more affordable option for buyers priced out here.
- Lawrence — north of Boston, often the most affordable larger city in eastern MA.
- New Bedford — a coastal alternative with different price dynamics than Worcester.
Frequently Asked Questions
What is the average home price in Worcester?
The average home price in Worcester, MA is $395,700 as of February 2026. That figure represents the Zillow Home Value Index across nine Worcester ZIP codes, with individual neighborhoods ranging from $189,397 to $531,728.
Are home prices going up or down in Worcester?
Up. Worcester home values rose 1.6% year over year through February 2026, with the steepest gains coming in the most recent four months. The median climbed from $389,521 in March 2025 to $395,700 by February 2026.
Is it cheaper to rent or buy in Worcester?
Renting. The average rent across Worcester ZIPs is about $2,129 per month, while a typical mortgage on the $395,700 median home runs closer to $2,652 once you include property taxes and insurance. That’s a $520 monthly gap in favor of renting.
What is the most affordable neighborhood in Worcester?
ZIP 01608 — downtown Worcester — has the lowest typical home value at $189,397, less than half the citywide median. The next most affordable area is 01610 at $356,001, covering the College Hill and South Worcester area.
Methodology
Home values are based on the Zillow Home Value Index (ZHVI), a smoothed measure of typical home values in the 35th to 65th percentile range. Rent estimates use the Zillow Observed Rent Index (ZORI). Population figures come from the U.S. Census Bureau Population Estimates Program (2020-2024 vintage). All datasets are publicly available. Housing data updated 2026-02-28.