Lynn Home Prices: $539K, Up 0.5% — 4 ZIPs Analyzed (2026)
$539,461. That’s what a typical home costs in Lynn, MA right now. Prices inched up 0.5% over the past year — not a surge, not a decline. A flat market with a slight upward tilt. For buyers watching the Boston metro from the sidelines, Lynn remains one of the more accessible entry points north of the city.
Quick answer: The average home price in Lynn, MA is $539,461 as of February 2026, up 0.5% year over year according to Zillow.
Current Home Prices in Lynn
| Metric | Value |
|---|---|
| Median Home Value | $539,461 |
| Year-over-Year Change | +0.5% |
| Lowest ZIP | $457,547 (01901) |
| Highest ZIP | $612,527 (01904) |
| Number of ZIPs Tracked | 4 |
| Data as of | February 2026 |
A half-percent annual gain means prices are essentially treading water when you factor in inflation. The gap between the cheapest and most expensive ZIP code is $155,000 — a meaningful spread for a city of Lynn’s size. That tells you location within the city matters.
The Boston-Cambridge-Newton metro continues to put pressure on surrounding cities. Lynn sits inside that metro area, which means its pricing doesn’t exist in a vacuum. Buyers priced out of Cambridge or Quincy look north. That demand floor helps explain why Lynn hasn’t seen the price drops that hit some Sun Belt markets.
Still, 0.5% growth is barely keeping pace with holding costs. If you bought a year ago, you’re roughly where you started after transaction fees. The market rewards patience right now, not speculation.
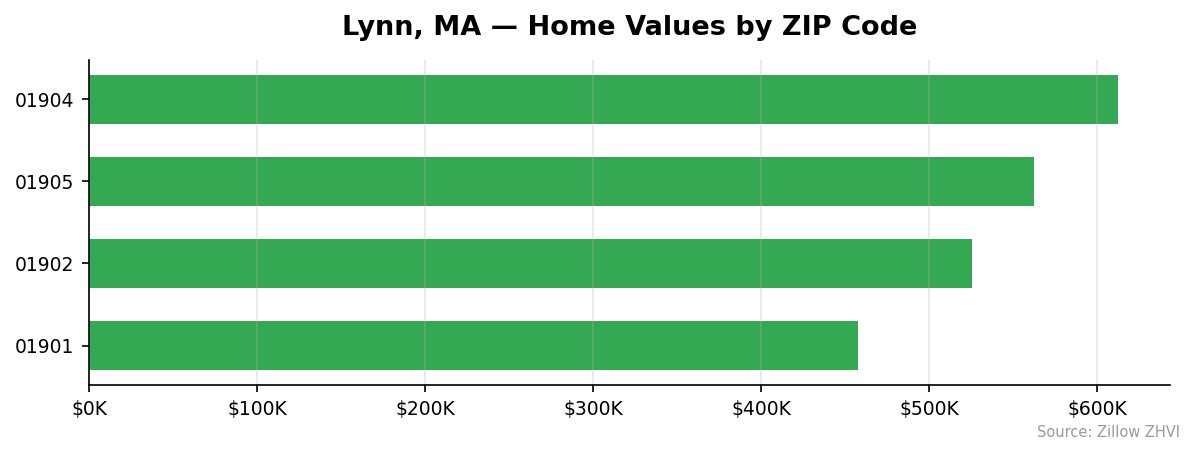
Lynn Home Prices by Neighborhood
| ZIP Code | Typical Home Value | vs. City Median |
|---|---|---|
| 01904 | $612,527 | +13.5% |
| 01905 | $562,512 | +4.3% |
| 01902 | $525,259 | -2.6% |
| 01901 | $457,547 | -15.2% |
Most Expensive
01904 leads at $612,527, sitting nearly $73,000 above the city median — the only ZIP in Lynn to break $600K.
01905 comes in at $562,512, about 4% above the citywide average, putting it in the upper-middle tier.
Most Affordable
01901 is the clear value play at $457,547, a full 15% below the city median. Rent data is available here too, with typical rents at $2,208 per month — the lowest in the city.
01902 sits just under the median at $525,259. Rents in this ZIP run $2,409 per month, the highest among ZIPs with rent data.
The $155,000 gap between 01904 and 01901 gives buyers real options. You can stay in Lynn and save six figures by choosing a different part of town.
Rent vs Buy in Lynn
Rent data is available for two of Lynn’s four ZIP codes.
| ZIP Code | Typical Monthly Rent | Typical Home Value |
|---|---|---|
| 01901 | $2,208 | $457,547 |
| 01902 | $2,409 | $525,259 |
At today’s mortgage rates — assume roughly 6.5% on a 30-year fixed with 20% down — a buyer purchasing at the city median of $539,461 would put down about $108,000 and finance $431,569. That monthly principal and interest payment comes to approximately $2,728. Add property taxes, insurance, and maintenance, and you’re looking at $3,200 to $3,500 per month in total housing cost.
Renting at $2,208 to $2,409 is $800 to $1,300 cheaper each month.
The math favors renting in the short term. But renting doesn’t build equity, and Lynn’s prices — while nearly flat — haven’t dropped. If you plan to stay five or more years, buying starts to close the gap. If you’re here for two years, rent and invest the difference.
Population Growth and Migration
Lynn’s population reached 103,489 in 2024, up 2.4% from 101,073 in 2020.
| Year | Population |
|---|---|
| 2020 | 101,073 |
| 2021 | 100,921 |
| 2022 | 101,210 |
| 2023 | 101,868 |
| 2024 | 103,489 |
The city actually lost residents in 2021 before reversing course. Growth accelerated in 2023 and 2024, with 1,621 people added in the most recent year alone. That’s the fastest single-year gain in this dataset.
How does Lynn compare to its Massachusetts peers?
| City | 2024 Population | 4-Year Growth |
|---|---|---|
| Worcester | 211,286 | +4.4% |
| Lowell | 120,418 | +4.0% |
| Cambridge | 121,186 | +2.5% |
| Lynn | 103,489 | +2.4% |
| Newton | 90,700 | +2.1% |
| Quincy | 103,434 | +1.9% |
Lynn’s growth rate lands in the middle of the pack — behind Worcester and Lowell, ahead of Newton and Quincy. More people means more housing demand. With only four ZIP codes and limited land, that population pressure has a floor-setting effect on prices.
Lynn Housing Market Trends
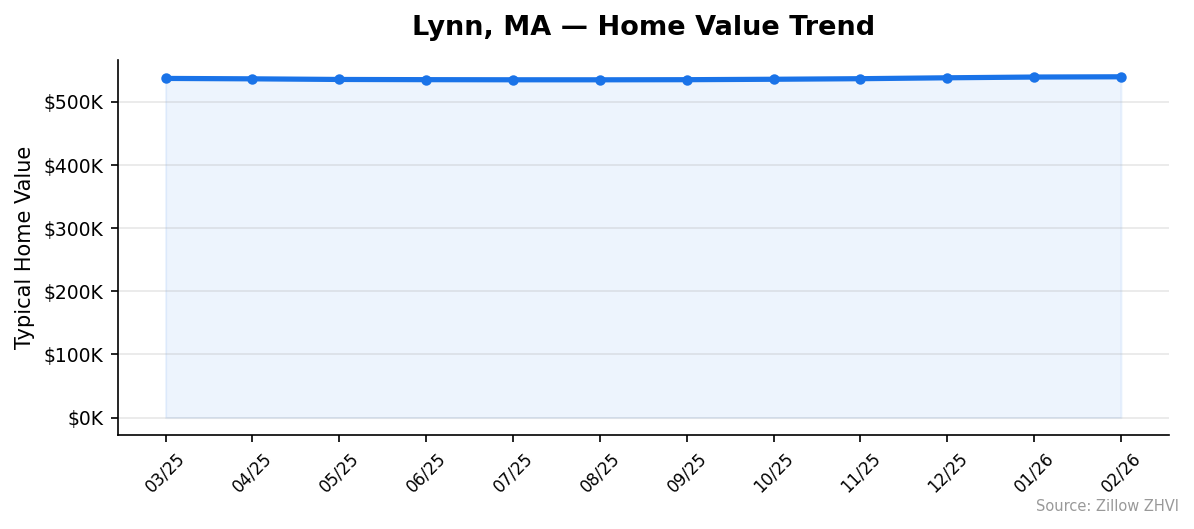
Here’s how the typical home value moved month by month over the past year.
| Month | Avg Home Value | Monthly Change |
|---|---|---|
| Feb 2026 | $539,461 | +$402 |
| Jan 2026 | $539,059 | +$1,183 |
| Dec 2025 | $537,876 | +$1,433 |
| Nov 2025 | $536,443 | +$899 |
| Oct 2025 | $535,544 | +$675 |
| Sep 2025 | $534,869 | +$186 |
| Aug 2025 | $534,683 | -$40 |
| Jul 2025 | $534,723 | -$199 |
| Jun 2025 | $534,922 | -$308 |
| May 2025 | $535,230 | -$998 |
| Apr 2025 | $536,228 | -$639 |
| Mar 2025 | $536,867 | — |
The trend tells a clear story in two halves. From March through August 2025, prices drifted lower — losing about $2,200 over six months. Then the direction reversed. September through February 2026 saw six straight months of gains, adding roughly $4,600.
The biggest single-month jump was December 2025 at +$1,433. The declines were shallow — never more than $1,000 in a single month. This pattern suggests a market that found a floor around $534K mid-year and has been grinding upward since.
Is Lynn a Good Place to Buy in 2026?
The data points to a stable market, not a hot one. A 0.5% annual gain won’t make anyone rich, but it also means you’re not buying into a declining market.
Lynn’s position in the Boston metro gives it structural support. You’re 10 miles from downtown Boston with commuter rail access. The median here — $539K — is a fraction of what you’d pay in Cambridge ($121K population, faster growth) or Brookline.
The risk? Flat prices mean your down payment isn’t growing. If rates drop and bring sidelined buyers back into the market, Lynn could see a bump. If rates stay elevated, expect more of the same — slow, grinding gains in the low single digits.
For owner-occupants who plan to stay five-plus years, the math works. For investors looking for appreciation, the returns are thin.
Lynn Housing Market Outlook for 2026-2027
Six consecutive months of price increases heading into February 2026 suggest continued upward momentum through spring. The gains are modest — averaging about $770 per month since September — but they’ve been consistent.
If the current pace continues, the median could reach $545,000 to $550,000 by late 2026. That’s not a bold prediction. It’s what happens if prices keep moving at the same $700–$1,400 monthly clips we’ve seen.
The population trend supports this. Lynn added 1,621 residents in 2024 alone, and housing supply in a four-ZIP city doesn’t expand quickly. More demand, constrained supply, stable prices — that combination favors gradual appreciation over any sharp moves in either direction.
Similar Markets in MA
If you’re shopping in Lynn, these Massachusetts cities are worth comparing:
- Quincy — Nearly identical population (103,434) with slightly slower growth at 1.9%.
- Lawrence — A more affordable alternative north of Boston for buyers stretching their budget.
- Lowell — Growing faster than Lynn at 4.0% and another commuter rail option into Boston.
- Worcester — The state’s fastest-growing large city at 4.4%, farther from Boston but with lower price points.
- Boston — The benchmark. If you can afford Boston proper, you probably aren’t looking at Lynn.
Frequently Asked Questions
What is the average home price in Lynn?
The average home price in Lynn, MA is $539,461 as of February 2026. Across the city’s four tracked ZIP codes, prices range from $457,547 in 01901 to $612,527 in 01904.
Are home prices going up or down in Lynn?
Prices are up 0.5% year over year. After a mild dip in mid-2025, the market reversed course in September and has posted six straight months of gains. The trend is modestly upward.
Is it cheaper to rent or buy in Lynn?
Renting is cheaper on a monthly basis. Typical rents run $2,208 to $2,409 per month, while buying at the median price would cost roughly $3,200 to $3,500 monthly including taxes and insurance. The gap is $800+ per month in favor of renting.
What is the most affordable neighborhood in Lynn?
ZIP code 01901 has the lowest typical home value at $457,547 — about $82,000 below the city median. It also has the lowest tracked rent at $2,208 per month.
Methodology
Home values are based on the Zillow Home Value Index (ZHVI), a smoothed measure of typical home values in the 35th to 65th percentile range. Rent estimates use the Zillow Observed Rent Index (ZORI). Population figures come from the U.S. Census Bureau Population Estimates Program (2020-2024 vintage). All datasets are publicly available. Housing data updated 2026-02-28.