Rapid City Home Prices: $364K, Up 2.4% — 3 ZIPs Analyzed (2026)
$363,992. That’s the typical home price in Rapid City right now, up 2.4% from a year ago. The market hasn’t posted a monthly decline since June 2025.
Quick answer: The average home price in Rapid City, SD is $363,992 as of February 2026, up 2.4% year over year according to Zillow.
Current Home Prices in Rapid City
The median sits at $363,992 across the three ZIP codes that make up Rapid City. That’s a $9,000 jump from where prices stood last spring.
| Metric | Value |
|---|---|
| Median home price | $363,992 |
| Year-over-year change | +2.4% |
| Cheapest ZIP | $297,460 (57701) |
| Priciest ZIP | $441,270 (57702) |
| Spread between ZIPs | $143,810 |
| Number of ZIPs analyzed | 3 |
| Data through | February 2026 |
The gap between the cheapest and most expensive neighborhood is about $144,000. That’s a 48% difference between the floor and the ceiling — meaningful, but tighter than what you’d see in larger metros where the spread can run 200% or more.
A 2.4% annual gain isn’t dramatic. It tracks below where US median prices have moved historically, but it’s a steady climb rather than a spike. For context, Rapid City didn’t experience the 15-20% pandemic-era surges some smaller mountain towns saw, and it isn’t correcting downward now either.
What you’re looking at is a small, slow-moving market. With only three ZIP codes covering the city, individual ZIP swings can move the average more than they would in a metro with 50 ZIPs. That makes the neighborhood-level data below worth reading carefully.
Rapid City Home Prices by Neighborhood
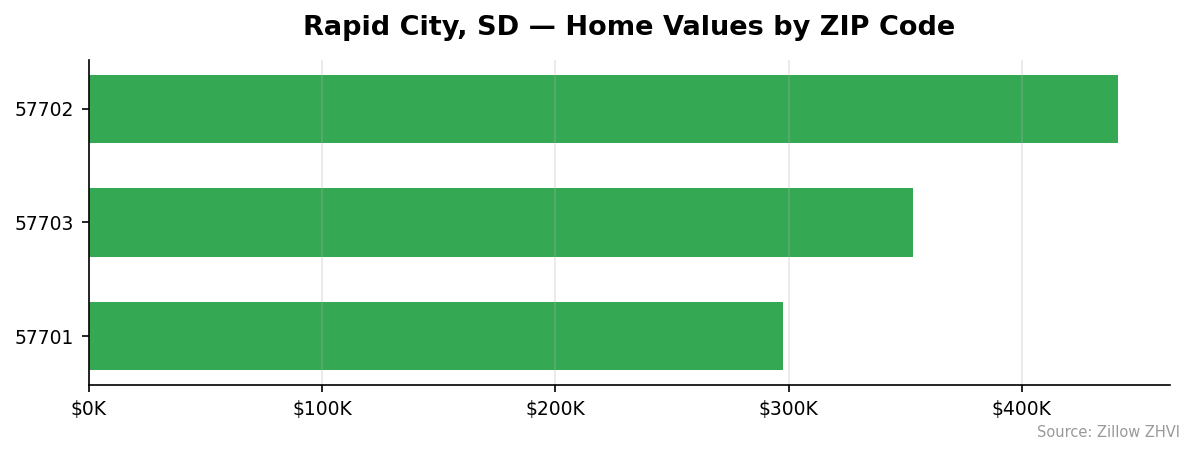
Three ZIPs, three different price tiers. Here’s the full breakdown:
| ZIP Code | Median Home Value | Median Rent | vs. City Avg |
|---|---|---|---|
| 57702 | $441,270 | $1,296 | +21.2% |
| 57703 | $353,247 | $1,378 | -3.0% |
| 57701 | $297,460 | $1,282 | -18.3% |
Most Expensive
57702 is the only ZIP that prices above the city average, at $441,270. That’s 21% above the citywide median and the only address in town that breaks $400K. Rent there runs $1,296 — interesting, because it’s not the highest rent in the city despite having the highest home values. That gap can flag where buying gets harder to justify versus renting.
Most Affordable
57701 is the cheapest at $297,460, sitting 18% below the city median. It’s the only Rapid City ZIP under $300K. Rent here is $1,282 — within $20 of the priciest ZIP’s rent, which means renters in 57701 aren’t getting much of a discount even though buyers are. 57703 lands in the middle at $353,247, just 3% below the citywide average, and its $1,378 rent is actually the highest of the three.
Rent vs Buy in Rapid City
Rents in Rapid City cluster tightly. The three ZIPs sit between $1,282 and $1,378, with an average around $1,319 per month.
Now run the buy math. On the $363,992 median home with 20% down ($72,798) and a 30-year fixed mortgage at 7%, principal and interest alone runs about $1,937 monthly. Add roughly $300 for property taxes and $100 for insurance, and you’re at $2,300+ per month before any HOA fees or maintenance.
| Cost | Rent (avg) | Buy (median, 20% down) |
|---|---|---|
| Monthly payment | $1,319 | ~$2,337 |
| Upfront cash | ~$2,000 (deposit) | ~$72,800 (down payment) |
| Annual cost | $15,828 | $28,044 |
Renting is the cheaper monthly option by roughly $1,000. Owning costs about 77% more per month than renting, before counting the $73K you’d need at closing.
That said, ZIP 57703 narrows the gap. With $1,378 rent and a $353,247 home value, buying still costs more — but the rent is higher relative to the home price than in 57701 or 57702. If you plan to stay 7+ years and want to build equity, 57703 has the friendliest rent-to-price ratio of the three.
The cheapest ZIP for buyers (57701) doesn’t translate into the cheapest place to rent. Rents are nearly flat across the city, so renters don’t get to “trade down” the way buyers can.
Population Growth and Migration
Rapid City is gaining residents. The Census Bureau pegged the 2024 population at 79,894, up from 74,943 in 2020 — a 6.6% gain over four years.
| Year | Population |
|---|---|
| 2020 | 74,943 |
| 2021 | 76,769 |
| 2022 | 78,702 |
| 2023 | 79,376 |
| 2024 | 79,894 |
Growth is decelerating. The city added about 1,800 people in 2021, 1,900 in 2022, but only 700 in 2023 and 500 in 2024. That’s a slowdown, not a reversal — population is still climbing — but the pace has flattened sharply.
Compare to Sioux Falls, the largest city in South Dakota:
| City | 2024 Population | 4-Year Growth |
|---|---|---|
| Sioux Falls | 209,289 | +8.2% |
| Rapid City | 79,894 | +6.6% |
Sioux Falls is roughly 2.6x the size and is growing faster on a percentage basis. Rapid City’s growth is real but more modest, and the deceleration in the last two years suggests demand pressure on housing is easing rather than building.
For housing, this matters. Steady population gains support steady price appreciation — which is exactly what the 2.4% YoY change shows. A boom isn’t likely. Neither is a crash.
Rapid City Housing Market Trends
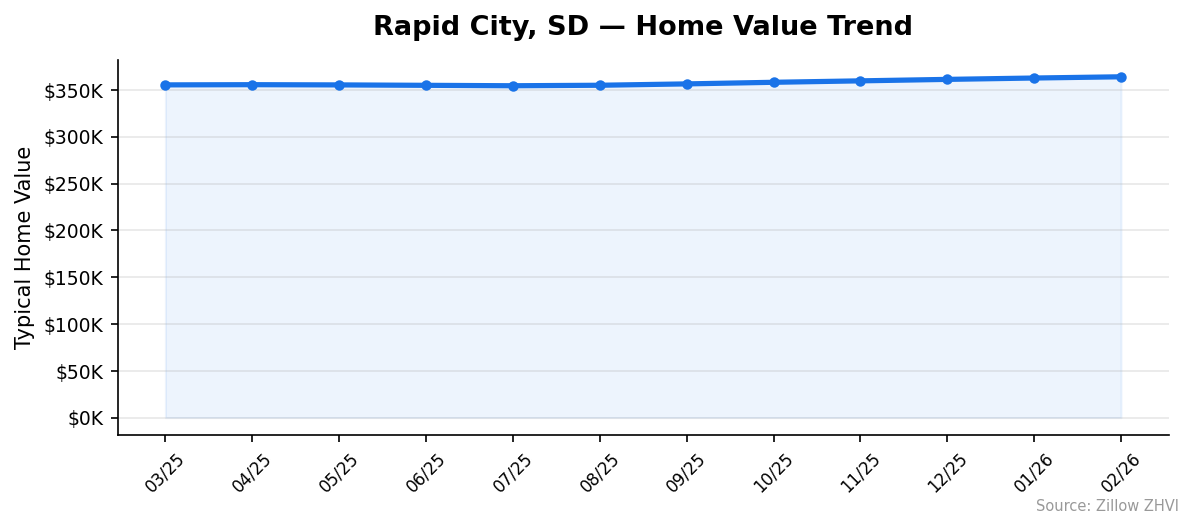
The 12-month price path tells a clear story:
| Month | Median Home Value |
|---|---|
| Mar 2025 | $355,349 |
| Apr 2025 | $355,565 |
| May 2025 | $355,323 |
| Jun 2025 | $354,882 |
| Jul 2025 | $354,425 |
| Aug 2025 | $354,950 |
| Sep 2025 | $356,401 |
| Oct 2025 | $358,117 |
| Nov 2025 | $359,646 |
| Dec 2025 | $361,220 |
| Jan 2026 | $362,676 |
| Feb 2026 | $363,992 |
Spring 2025 was flat. Summer 2025 dipped slightly — three consecutive months of small declines from May through July. Then the market reversed in August and has gained every month since.
Total gain over 12 months: $8,643, or about 2.4%. Total gain over the last 6 months: $7,591. That means almost 88% of the year’s appreciation came in the second half, with momentum building each month.
The most recent monthly gain ($1,316 from January to February) is roughly in line with the prior three months. No deceleration yet.
Is Rapid City a Good Place to Buy in 2026?
The data points to a slow seller’s market. Prices have risen for eight straight months, the YoY trend is positive, and population continues to grow. None of that favors buyers.
But the gains are modest. A 2.4% annual increase trails inflation in most years, which means real (inflation-adjusted) prices are roughly flat or slightly negative. You’re not racing the market the way you would in a 10%+ appreciation environment.
Renting wins on monthly cash flow by a wide margin. If you’re not planning to stay 5-7 years, the math heavily favors renting.
If you’re committed to Rapid City long-term and want to own:
- Best value tier: 57701 at $297,460 — sub-$300K entry point
- Best rent-to-price: 57703 at $353,247 with $1,378 rent
- Premium: 57702 at $441,270, the only $400K+ option
This isn’t a market where you need to move fast or stretch your budget. The pace gives you time.
Rapid City Housing Market Outlook for 2026-2027
Pace of gains has accelerated since August 2025. The last three months show $1,316–$1,574 in monthly increases — averaging about $1,450 per month. If that pace continues, prices would cross $370,000 by mid-2026 and approach $380,000 by year-end.
The 6-month trend is stronger than the 12-month trend, suggesting the market still has momentum heading into the spring 2026 buying season. Population growth has slowed but not stopped, which supports continued — but moderate — price gains.
The risk to this outlook is the population deceleration. If 2025 Census estimates show another year of sub-1% growth, the demand-side support for further price gains could weaken in late 2026. For now, the trend points up.
Similar Markets in SD
- Sioux Falls — South Dakota’s largest city, growing faster than Rapid City at 8.2% over four years and worth comparing if you’re flexible on location within the state.
Frequently Asked Questions
What is the average home price in Rapid City?
The average home price in Rapid City, SD is $363,992 as of February 2026. That figure is the median across three ZIP codes (57701, 57702, 57703), with individual ZIP medians ranging from $297,460 to $441,270.
Are home prices going up or down in Rapid City?
Prices are up 2.4% year over year. The market dipped slightly in summer 2025 but has gained ground every month since August 2025, adding about $7,600 in the last six months alone.
Is it cheaper to rent or buy in Rapid City?
Renting is cheaper. The average rent across Rapid City ZIPs is about $1,319 per month, while a mortgage on the $363,992 median home with 20% down runs roughly $2,300 monthly including taxes and insurance. That’s about $1,000 more per month to own.
What is the most affordable neighborhood in Rapid City?
ZIP 57701 is the cheapest at a $297,460 median home value — 18% below the city average and the only Rapid City ZIP under $300,000. Rent there is $1,282, just slightly below the citywide average.
Methodology
Home values are based on the Zillow Home Value Index (ZHVI), a smoothed measure of typical home values in the 35th to 65th percentile range. Rent estimates use the Zillow Observed Rent Index (ZORI). Population figures come from the U.S. Census Bureau Population Estimates Program (2020-2024 vintage). All datasets are publicly available. Housing data updated 2026-02-28.