Lacey Home Prices: $520K, Up 0.6% — 3 ZIPs Analyzed (2026)
$520,205. That’s the typical home value in Lacey as of February 2026. Prices nudged up 0.6% over the past year — modest, but positive in a state where several markets cooled.
Quick answer: The average home price in Lacey, WA is $520,205 as of February 2026, up 0.6% year over year according to Zillow.
Current Home Prices in Lacey
| Metric | Value |
|---|---|
| Median home value | $520,205 |
| Year-over-year change | +0.6% |
| Lowest ZIP median | $481,607 |
| Highest ZIP median | $576,989 |
| Price spread | $95,382 |
| ZIP codes analyzed | 3 |
| Data through | February 2026 |
The $520K median puts Lacey roughly in line with Olympia, its larger neighbor in the same metro. The gain is small — about $3,000 across twelve months in nominal terms, and well below typical inflation. In real terms, owners are basically flat.
The spread between the cheapest and priciest ZIP runs near $95,000. That’s a wider gap than you’d expect in a city of 58,000 people. It tells you Lacey isn’t one market — it’s at least three, with different floors and ceilings.
Compare the 0.6% gain here to what Seattle or Tacoma posted, and you get a clear picture. The Olympia metro moves slower than King County. Buyers priced out of Seattle have been heading south for years, but the wave lifted Lacey only gently.
The data shows stability, not a boom. The minimum ZIP rose, the maximum ZIP rose, and the average tracked along with both. No outlier neighborhood is pulling the city up or dragging it down.
If you’re shopping here, a $520K budget gets you the typical home. About $480K still buys in 98503. Above $580K opens up everything in 98516.
Lacey Home Prices by Neighborhood
| ZIP Code | Median Home Value | Median Rent (ZORI) |
|---|---|---|
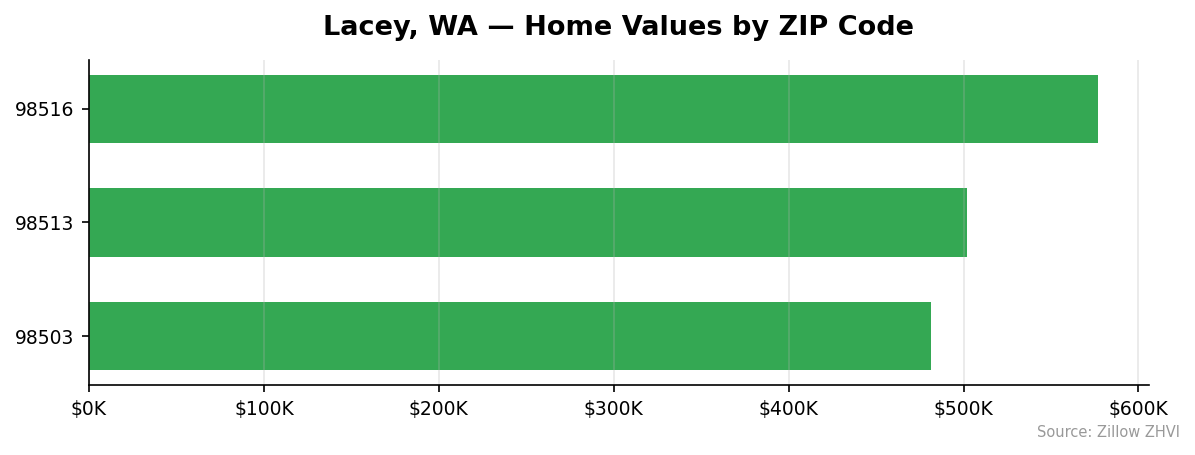
| 98516 | $576,989 | $2,026 |
| 98513 | $502,018 | $2,244 |
| 98503 | $481,607 | $1,971 |
Most Expensive
- 98516 at $576,989 sits about $57,000 above the city median. Rent here is $2,026 — lower than the middle ZIP, which points to an owner-heavy mix and larger homes.
- 98513 at $502,018 lands just below the city average but commands the highest rent at $2,244, a sign of stronger rental demand or newer multifamily stock.
- Only three ZIPs report data, so a third tier doesn’t apply.
Most Affordable
- 98503 at $481,607 is the entry point — about $39,000 below the city median and the cheapest place to buy in Lacey.
- Rent in 98503 sits at $1,971, also the lowest of the three.
- The combination of lower buy prices and lower rent points to older housing stock and smaller homes.
The interesting outlier is 98513. Highest rent, middle-tier home values. That gap — $2,244 in rent against a $502K home — produces a better rent-to-price ratio than either of the other ZIPs. For a small landlord, the math works best there.
Rent vs Buy in Lacey
| ZIP | Median Rent | Annual Rent |
|---|---|---|
| 98503 | $1,971 | $23,652 |
| 98513 | $2,244 | $26,928 |
| 98516 | $2,026 | $24,312 |
The average ZIP rent runs around $2,080 per month.
A 30-year mortgage on a $520,205 home with 20% down ($104,041 down, $416,164 financed) at a 6.75% rate produces a principal-and-interest payment near $2,700 per month. Add Thurston County property tax at roughly 1% — about $433 monthly. Insurance lands near $130. That brings the all-in monthly to about $3,260 before HOA or maintenance.
So a typical mortgage runs about $1,180 more per month than the typical rent.
Over a year, the buyer pays roughly $14,000 more in cash outflow than the renter, before any tax write-offs or principal building. Buying makes sense if you plan to stay five-plus years, expect home values to keep climbing at least the current 0.6% pace, and value the equity build.
Renters in 98503 keep the lowest monthly outlay at $1,971. If your income hasn’t kept up with prices, renting in the cheapest ZIP buys you time.
Population Growth and Migration
Lacey hit 58,644 residents in 2024, up from 56,764 in 2020. That’s a 3.3% gain across four years.
| Year | Population |
|---|---|
| 2020 | 56,764 |
| 2021 | 57,136 |
| 2022 | 57,994 |
| 2023 | 58,234 |
| 2024 | 58,644 |
The growth has been steady — 372 new residents in 2021, 858 in 2022, 240 in 2023, and 410 in 2024. The city adds people every year, just not at a runaway pace.
Compared to other Washington cities:
| City | 2024 Population | 4-Year Growth |
|---|---|---|
| Seattle | 780,995 | +5.5% |
| Spokane Valley | 108,267 | +4.5% |
| Vancouver | 198,992 | +4.0% |
| Tacoma | 228,202 | +3.8% |
| Lacey | 58,644 | +3.3% |
| Everett | 113,011 | +1.9% |
Lacey beats Everett but trails the larger Puget Sound cities. The 3.3% gain is enough to keep housing demand above replacement — new household formation is outpacing new home construction. That’s part of why prices haven’t fallen even with high mortgage rates.
For a buyer, slow-but-positive growth means downside risk on home values stays limited. For a seller, the pool of in-migrating buyers is real but not deep.
Lacey Housing Market Trends
| Month | Median Home Value |
|---|---|
| 2026-02 | $520,205 |
| 2026-01 | $519,937 |
| 2025-12 | $518,897 |
| 2025-11 | $517,280 |
| 2025-10 | $515,397 |
| 2025-09 | $513,874 |
| 2025-08 | $512,749 |
| 2025-07 | $512,696 |
| 2025-06 | $513,252 |
| 2025-05 | $514,299 |
| 2025-04 | $515,748 |
| 2025-03 | $517,294 |
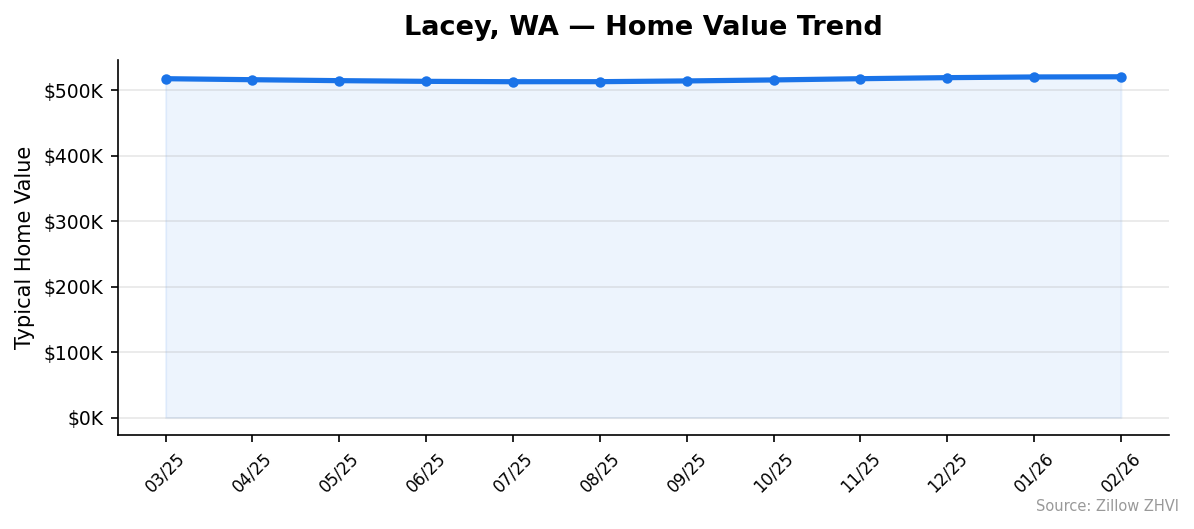
The pattern is a shallow U. Prices started at $517K in March 2025, dipped to $512,696 in July, then climbed back through fall and winter to crest above $520K in February 2026.
That’s a $7,500 swing peak-to-trough — about 1.5%. The trend is mildly positive: the line ends above where it started 12 months ago, just barely.
Most months posted gains of $1,000 to $2,000. The biggest single-month jump was $1,883 from October to November. The biggest pullback was $1,047 from May to June.
You’re not looking at a hot market. You’re looking at a market that held its value while prices in many comparable Western cities softened.
Is Lacey a Good Place to Buy in 2026?
The data points to a balanced market. Prices are up 0.6% year over year, which is below inflation but positive. The 12-month trend dipped, then recovered, finishing higher than it started. No collapse, no boom.
If you’re a buyer, you have time. Prices aren’t running away — recent monthly gains have averaged about $1,000. That’s not the kind of pace that punishes you for waiting six months to find the right house.
For sellers, you’re not in a position to push pricing aggressively. Comparable sales are stable, not climbing fast. Realistic listings will move; ambitious ones will sit.
The rent-to-buy gap of about $1,180 per month favors renting on cash flow. Buying favors longer-term holders who want stability and equity build over time. If you’re staying less than three years, the math leans toward renting unless you have unusual confidence in price gains.
Lacey Housing Market Outlook for 2026-2027
The 3-month trend from December through February shows monthly gains of $268 to $1,617, averaging near $1,000. If the current pace continues, Lacey could add another $5,000–$10,000 to the median across the next six months, putting it in the $525K–$530K range.
The recovery from the July 2025 trough has been consistent. Eight straight months of gains is a real signal, even if each month’s gain is small.
The 3.3% population growth over four years should keep demand steady. With no oversupply visible in the data, prices are unlikely to drop sharply in the near term.
The main risk is mortgage rates. If rates rise further, the rent-vs-buy math tilts even more toward renting, and gains could stall. If rates fall, the recent pace could pick up speed.
Similar Markets in WA
- Olympia — Lacey’s neighbor in the same metro, similar price range, comparable buyer profile.
- Vancouver — Southern WA market with similar growth but different metro dynamics.
- Everett — Puget Sound city with slower 1.9% growth, useful for comparing rent-side trends.
- Bellingham — Smaller north-state city with comparable median housing prices.
- Seattle — The big benchmark; many Lacey buyers are pricing out of Seattle and heading south.
Frequently Asked Questions
What is the average home price in Lacey?
The average home price in Lacey, WA is $520,205 as of February 2026, based on Zillow Home Value Index data across three ZIP codes. The figure represents typical homes in the middle 30% of the market. It’s up just $3,000 from twelve months earlier.
Are home prices going up or down in Lacey?
Up — but barely. Lacey’s median home value gained 0.6% year over year through February 2026. After bottoming at $512,696 in July 2025, prices climbed eight months in a row to reach the current level.
Is it cheaper to rent or buy in Lacey?
Renting is cheaper on a monthly basis. The average ZIP rent runs about $2,080, while a typical mortgage on a $520K home with 20% down at 6.75% comes to roughly $3,260 once property tax and insurance are added. The gap is about $1,180 per month in renters’ favor.
What is the most affordable neighborhood in Lacey?
ZIP 98503 is the most affordable area in Lacey at a $481,607 median home value — about $39,000 below the city average. Rent there is also the lowest at $1,971 per month, which suggests older housing stock and smaller homes.
Methodology
Home values are based on the Zillow Home Value Index (ZHVI), a smoothed measure of typical home values in the 35th to 65th percentile range. Rent estimates use the Zillow Observed Rent Index (ZORI). Population figures come from the U.S. Census Bureau Population Estimates Program (2020-2024 vintage). All datasets are publicly available. Housing data updated 2026-02-28.