Salem Home Prices: $452K, Up 0.5% — 5 ZIPs Analyzed (2026)
$452,106. That’s what a typical home costs in Salem, Oregon’s capital city. Prices inched up 0.5% over the past year — barely enough to notice, but enough to confirm the market isn’t sliding backward.
Quick answer: The average home price in Salem, OR is $452,106 as of February 2026, up 0.5% year over year according to Zillow.
Current Home Prices in Salem
The Salem housing market is flat by most standards. A half-percent annual gain means a home worth $450,000 last February is worth about $2,250 more today. That’s not much.
| Metric | Value |
|---|---|
| Median Home Price | $452,106 |
| Year-over-Year Change | +0.5% |
| Lowest ZIP Median | $365,641 |
| Highest ZIP Median | $494,574 |
| ZIP Codes Tracked | 5 |
| Data Through | February 2026 |
The gap between the cheapest and most expensive ZIP is about $129,000. That spread gives buyers real options depending on budget. If you’re shopping under $400,000, one ZIP code still qualifies. If you’ve got more to spend, northwest Salem pushes close to $500,000.
Compared to Portland, where medians run well above $500,000, Salem remains a more accessible market. But “accessible” is relative — $452K still requires a household income north of $100,000 to qualify for a conventional mortgage at current rates.
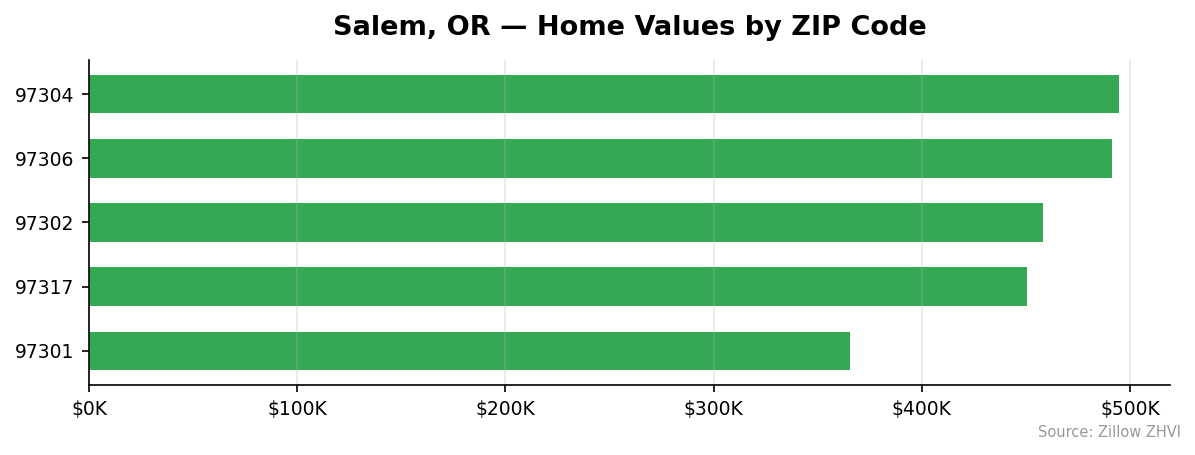
Salem Home Prices by Neighborhood
Five ZIP codes cover most of Salem proper. The price differences are meaningful — nearly $130,000 separates the most and least expensive areas.
| ZIP Code | Median Home Price | Median Rent |
|---|---|---|
| 97301 | $365,641 | $1,493/mo |
| 97302 | $458,158 | $1,546/mo |
| 97304 | $494,574 | $1,774/mo |
| 97306 | $491,586 | $1,762/mo |
| 97317 | $450,573 | $1,547/mo |
Most Expensive
97304 leads at $494,574, about $42,000 above the city median — rents here are also the highest at $1,774 per month. 97306 follows closely at $491,586 with similarly elevated rents of $1,762. 97302 comes in third at $458,158, sitting just above the citywide average.
Most Affordable
97301 is the clear budget pick at $365,641 — roughly 19% below the city median and the only ZIP under $400,000. Rent here is the lowest too at $1,493 per month. 97317 at $450,573 and 97302 at $458,158 round out the more moderate options, both hovering near the city average.
Rent vs Buy in Salem
Renting is cheaper than buying in every Salem ZIP code right now. The math isn’t close.
The citywide average rent runs about $1,625 per month across all five tracked ZIPs. A mortgage on the $452,106 median home — assuming 20% down, a 7% rate, and a 30-year term — costs roughly $2,405 per month in principal and interest alone. Add property taxes and insurance, and you’re looking at $2,700 or more.
| ZIP Code | Monthly Rent | Estimated Mortgage* |
|---|---|---|
| 97301 | $1,493 | $1,946 |
| 97302 | $1,546 | $2,437 |
| 97304 | $1,774 | $2,631 |
| 97306 | $1,762 | $2,615 |
| 97317 | $1,547 | $2,396 |
*Principal and interest only, 20% down, 7% rate, 30-year fixed.
Even in the cheapest ZIP (97301), the mortgage runs $453 more than rent each month. In 97304, that gap widens to $857. For buyers, the upside is equity. For renters, the upside is cash flow. Neither answer is wrong — it depends on how long you plan to stay.
Population Growth and Migration
Salem has been growing, but slowly. The city added about 4,400 residents between 2020 and 2024, bringing the total to 180,406.
| Year | Population |
|---|---|
| 2020 | 175,977 |
| 2021 | 178,215 |
| 2022 | 180,167 |
| 2023 | 179,519 |
| 2024 | 180,406 |
There’s a dip in 2023 — the city lost about 650 people that year before recovering in 2024. Overall, the 2.5% four-year growth rate is modest.
How does Salem compare to other Oregon cities?
| City | 2024 Population | 4-Year Growth |
|---|---|---|
| Bend | 106,926 | 7.3% |
| Corvallis | 61,993 | 6.3% |
| Tigard | 57,301 | 4.1% |
| Hillsboro | 110,337 | 3.0% |
| Salem | 180,406 | 2.5% |
| Beaverton | 98,302 | 0.8% |
Bend and Corvallis are growing much faster, but they’re also smaller cities. Salem’s 2.5% growth on a base of 176,000 still means more total new residents than most of those faster-growing peers. Steady population growth supports housing demand without overheating prices — which may explain why Salem’s market has been so flat.
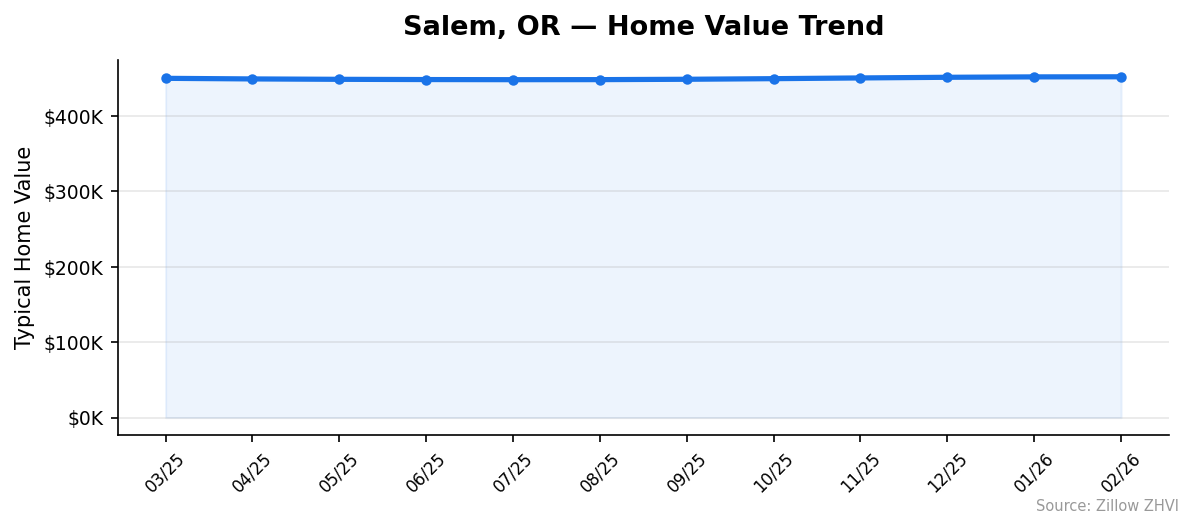
Salem Housing Market Trends
The 12-month trend tells a story of a market that bottomed out in mid-2025 and has been slowly recovering since.
| Month | Average Price | Low ZIP | High ZIP |
|---|---|---|---|
| Mar 2025 | $450,064 | $365,997 | $492,411 |
| Apr 2025 | $449,271 | $365,030 | $491,235 |
| May 2025 | $448,750 | $364,346 | $490,002 |
| Jun 2025 | $448,438 | $364,095 | $489,211 |
| Jul 2025 | $448,270 | $364,021 | $488,688 |
| Aug 2025 | $448,337 | $364,015 | $488,881 |
| Sep 2025 | $448,812 | $364,063 | $489,594 |
| Oct 2025 | $449,616 | $364,145 | $491,254 |
| Nov 2025 | $450,580 | $364,559 | $492,802 |
| Dec 2025 | $451,447 | $365,110 | $494,044 |
| Jan 2026 | $451,979 | $365,560 | $494,475 |
| Feb 2026 | $452,106 | $365,641 | $494,574 |
Prices dropped from March through July 2025, losing about $1,800 in total. That’s a shallow dip. Since August, they’ve climbed back steadily — gaining about $3,800 over seven months. The recovery has been gradual and consistent, with no sharp swings in either direction.
Is Salem a Good Place to Buy in 2026?
The numbers point to a balanced market. Prices aren’t spiking, and they aren’t falling. A 0.5% annual gain barely keeps pace with inflation, which means in real terms, homes haven’t gotten more expensive.
For buyers, that’s good news. You’re not chasing a runaway market. There’s time to shop, compare, and negotiate. The $129,000 spread across ZIP codes means you can stretch your budget by choosing 97301 over 97304 — and save on rent in the meantime.
For sellers, don’t expect bidding wars. Price your home at market value and be patient.
Salem’s population is growing, the state capital brings stable government employment, and prices sit well below Portland’s. Those fundamentals support the market even if they don’t drive rapid appreciation.
Salem Housing Market Outlook for 2026-2027
The three-month trend from December 2025 through February 2026 shows prices gaining about $200 per month. That’s a crawl, but it’s consistent.
If the current pace continues, Salem’s median could reach the $455,000-$458,000 range by late 2026. The upward momentum since August 2025 hasn’t shown signs of stalling, though gains have been decelerating slightly in recent months.
The biggest risk to this trajectory would be rising mortgage rates, which could dampen buyer activity. On the other hand, steady population growth and Salem’s affordability relative to Portland provide a floor. A major correction looks unlikely based on what the data shows today.
Similar Markets in OR
If you’re considering Salem, these other Oregon markets may be worth a look:
- Portland — Oregon’s largest city, with higher prices but more inventory and amenities.
- Eugene — A university town with a different buyer profile, about an hour south.
- Bend — Growing fast at 7.3%, with an outdoor-recreation economy that draws transplants.
- Beaverton — Just outside Portland, growing at only 0.8% — an even flatter market than Salem.
- Grants Pass — Southern Oregon option for buyers looking at smaller-city living.
Frequently Asked Questions
What is the average home price in Salem?
The average home price in Salem, OR is $452,106 as of February 2026. Prices range from $365,641 in ZIP 97301 to $494,574 in ZIP 97304. The citywide median puts Salem well below Portland but above many smaller Oregon cities.
Are home prices going up or down in Salem?
Prices are up 0.5% year over year. They dipped slightly from March through July 2025, bottoming at $448,270, then recovered through the fall and winter. The trend since August 2025 has been upward every single month.
Is it cheaper to rent or buy in Salem?
Renting is cheaper across the board. The average Salem rent is about $1,625 per month, while an estimated mortgage on the median home runs roughly $2,400-$2,700 depending on taxes and insurance. That’s a gap of $800 to $1,100 per month in favor of renting.
What is the most affordable neighborhood in Salem?
ZIP code 97301 is the most affordable at $365,641 — about 19% below the city median. Rent in 97301 is also the lowest at $1,493 per month. It’s the only Salem ZIP where you can buy a typical home for under $400,000.
Methodology
Home values are based on the Zillow Home Value Index (ZHVI), a smoothed measure of typical home values in the 35th to 65th percentile range. Rent estimates use the Zillow Observed Rent Index (ZORI). Population figures come from the U.S. Census Bureau Population Estimates Program (2020-2024 vintage). All datasets are publicly available. Housing data updated 2026-02-28.