Springfield Home Prices: $256K, Up 1.7% — 7 ZIPs Analyzed (2026)
$256,197. That’s what a typical home costs in Springfield, MO right now. Prices are up 1.7% from a year ago, and the gap between the cheapest and most expensive ZIP codes stretches over $300,000. Whether you’re looking at a starter home in 65806 or a higher-end neighborhood in 65809, the numbers tell very different stories.
Quick answer: The average home price in Springfield, MO is $256,197 as of February 2026, up 1.7% year over year according to Zillow.
Current Home Prices in Springfield
Here’s where Springfield stands as of February 2026:
| Metric | Value |
|---|---|
| Median Home Price | $256,197 |
| Year-over-Year Change | +1.7% |
| Lowest ZIP Median | $132,763 |
| Highest ZIP Median | $437,530 |
| Number of ZIPs Tracked | 7 |
A 1.7% annual increase is modest. Springfield isn’t seeing the double-digit swings that made headlines in Sun Belt metros over the past few years. The city’s price growth sits well below national hotspots but keeps pace with inflation.
The spread between the cheapest and most expensive neighborhoods is $304,767. That’s a nearly 3.3x difference. In practical terms, you could buy three homes in 65806 for what one costs in 65809.
Month over month, the median ticked up from $255,321 in January to $256,197 in February — a $876 gain. Not dramatic, but consistent with the upward drift visible across the past year.
For buyers, Springfield remains one of the more accessible metros in Missouri. The $256K median sits well below the national median, and several ZIPs offer entry points under $210,000.
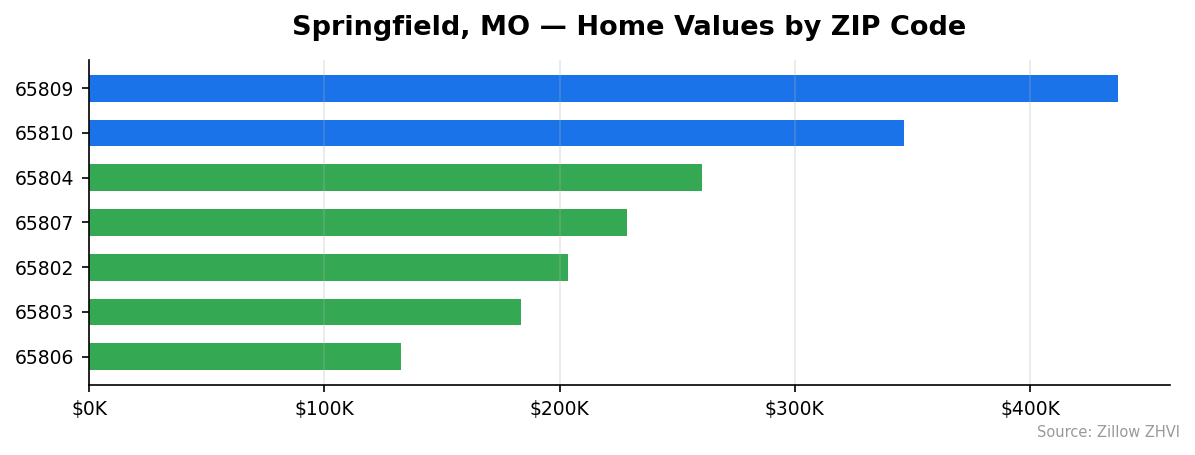
Springfield Home Prices by Neighborhood
All seven tracked ZIP codes, ranked from most to least expensive:
| ZIP Code | Median Home Value | Avg. Monthly Rent |
|---|---|---|
| 65809 | $437,530 | N/A |
| 65810 | $346,249 | $1,967 |
| 65804 | $260,671 | $1,267 |
| 65807 | $228,665 | $1,226 |
| 65802 | $203,775 | $1,151 |
| 65803 | $183,725 | $1,132 |
| 65806 | $132,763 | $1,096 |
Most Expensive ZIPs
65809 tops the list at $437,530, sitting 71% above the city median — rent data isn’t available for this area. 65810 comes in at $346,249 with rents averaging $1,967, the highest in the city by a wide margin. 65804 at $260,671 sits just above the city average and carries rents of $1,267.
Most Affordable ZIPs
65806 is the clear bargain at $132,763, nearly half the citywide median and the only ZIP under $150K. 65803 offers homes around $183,725 with rents at $1,132. 65802 rounds out the bottom three at $203,775, still about $52,000 below the city median.
The affordability gap between these neighborhoods means first-time buyers have real options. A home in 65806 costs less than a 30% down payment on a home in 65809.
Rent vs Buy in Springfield
Rent data is available for six of Springfield’s seven ZIP codes. Here’s how the numbers stack up:
| ZIP Code | Monthly Rent | Home Price | Price-to-Rent Ratio |
|---|---|---|---|
| 65806 | $1,096 | $132,763 | 10.1x |
| 65803 | $1,132 | $183,725 | 13.5x |
| 65802 | $1,151 | $203,775 | 14.7x |
| 65807 | $1,226 | $228,665 | 15.5x |
| 65804 | $1,267 | $260,671 | 17.1x |
| 65810 | $1,967 | $346,249 | 14.7x |
The price-to-rent ratio tells you how many years of rent equals the home price. Lower ratios favor buying. At 10.1x, ZIP 65806 leans toward buying — you’d pay for the house in about 10 years of rent.
A rough mortgage estimate: on a $256,197 home with 20% down ($51,239), a 30-year fixed mortgage at 7% runs about $1,363 per month in principal and interest. Add taxes and insurance, and you’re looking at roughly $1,600–$1,750.
Most Springfield rents fall between $1,096 and $1,267. Renting is cheaper on a pure monthly basis in most ZIPs. But in 65806, where rents hit $1,096 and home prices sit at $133K, the math shifts. A mortgage there would run around $710 per month before taxes and insurance — well below the rent.
Population Growth and Migration
Springfield’s population reached 170,596 in 2024. Growth has been slow but steady.
| Year | Population |
|---|---|
| 2020 | 169,158 |
| 2021 | 169,251 |
| 2022 | 170,079 |
| 2023 | 170,446 |
| 2024 | 170,596 |
That’s a 0.9% gain over four years — about 1,438 additional residents. Springfield is growing, but barely. The city added most of its new residents between 2021 and 2022 (828 people) and has slowed since.
How does Springfield compare to other Missouri cities?
| City | 2024 Population | 4-Year Growth |
|---|---|---|
| St. Peters | 61,398 | 6.4% |
| Lee’s Summit | 106,419 | 4.8% |
| O’Fallon | 95,355 | 4.0% |
| Blue Springs | 61,246 | 4.0% |
| Columbia | 130,900 | 3.6% |
| Springfield | 170,596 | 0.9% |
Springfield is the largest city on this list but has the slowest growth rate. The Kansas City suburbs (Lee’s Summit, Blue Springs) and St. Louis suburbs (St. Peters, O’Fallon) are all growing much faster. This slower population growth helps explain why Springfield’s home prices aren’t surging — demand isn’t spiking the way it is in those suburban corridors.
Springfield Housing Market Trends
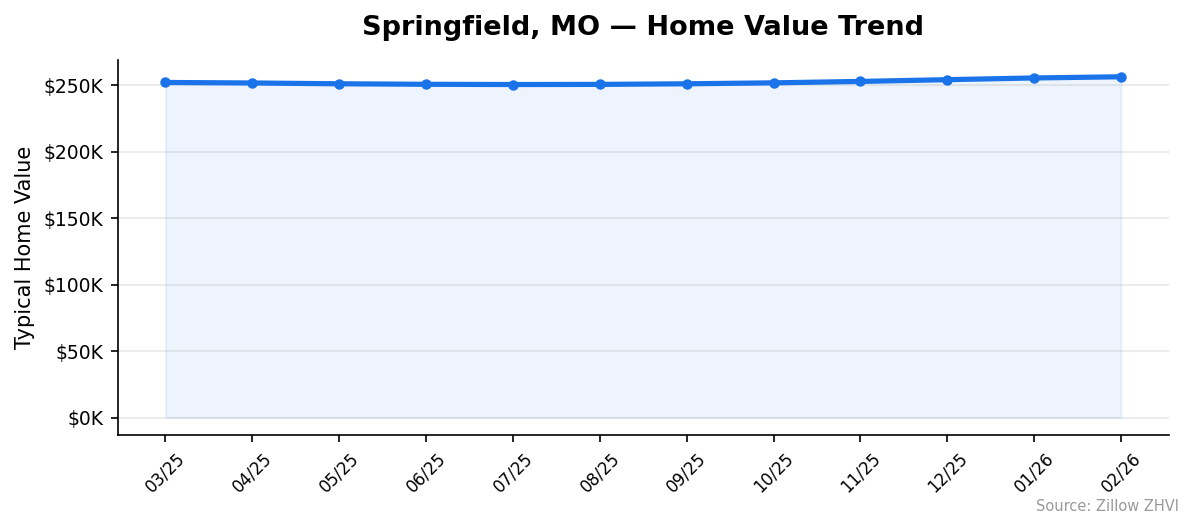
Here’s the 12-month price trajectory:
| Month | Average Value | Low | High |
|---|---|---|---|
| Feb 2026 | $256,197 | $132,763 | $437,530 |
| Jan 2026 | $255,321 | $132,101 | $436,925 |
| Dec 2025 | $254,029 | $131,080 | $435,310 |
| Nov 2025 | $252,708 | $130,531 | $433,133 |
| Oct 2025 | $251,639 | $130,400 | $430,817 |
| Sep 2025 | $250,935 | $130,470 | $428,820 |
| Aug 2025 | $250,478 | $130,600 | $427,335 |
| Jul 2025 | $250,378 | $130,911 | $426,522 |
| Jun 2025 | $250,558 | $131,536 | $426,212 |
| May 2025 | $250,941 | $132,194 | $426,153 |
| Apr 2025 | $251,540 | $132,735 | $426,594 |
| Mar 2025 | $251,933 | $133,065 | $426,724 |
The trend shows a shallow dip through mid-2025 followed by steady recovery. Prices bottomed around July 2025 at $250,378 and have climbed every month since, gaining $5,819 over seven months.
The low end of the market (cheapest ZIP) actually dropped from $133,065 in March 2025 to $130,400 in October before recovering to $132,763. The high end has been more consistent, rising from $426,153 in May to $437,530 in February — an $11,377 gain.
Higher-priced neighborhoods are appreciating faster than lower-priced ones. That’s widening the gap between Springfield’s most and least expensive areas.
Is Springfield a Good Place to Buy in 2026?
The data points to a stable market with a mild upward tilt. At $256K, Springfield sits well below the national median, and several ZIPs offer homes under $210K. That’s a low barrier to entry compared to most mid-size metros.
Price growth of 1.7% annually won’t build equity fast, but it won’t destroy it either. You’re not buying into a bubble. The slow population growth (0.9% over four years) means demand isn’t outstripping supply the way it does in boomtown markets.
For renters considering the switch, the math depends heavily on your ZIP. In 65806, buying is clearly cheaper than renting. In 65804 or 65810, renting wins on monthly cost unless you plan to stay long enough for equity to offset the higher payments.
Springfield favors patient buyers. This isn’t a market where you need to rush, but it’s also not one where waiting will save you money — prices are inching up every month.
Springfield Housing Market Outlook for 2026-2027
The seven-month upward streak from July 2025 through February 2026 shows consistent momentum. Monthly gains have averaged about $831 per month during that run.
If the current pace continues, Springfield’s median could reach the $260K–$265K range by late 2026. That’s not a guarantee — seasonal slowdowns or rate changes could flatten the curve.
The high-end ZIPs (65809, 65810) are appreciating faster than the city average. Expect the gap between Springfield’s most and least expensive neighborhoods to keep widening.
Nothing in the data suggests a correction is coming. Growth is too slow and steady to indicate overheating. The more likely scenario is continued modest appreciation in the 1.5%–2.5% annual range.
Similar Markets in MO
If you’re shopping in Springfield, these Missouri cities offer different price points and growth profiles:
- Columbia — A college town about two hours north, Columbia has a larger university-driven economy and faster population growth at 3.6%.
- Kansas City — The state’s largest metro offers more job diversity and suburban options for buyers who need a bigger market.
- Jefferson City — The state capital is smaller and may offer comparable affordability with government-sector stability.
- Independence — A Kansas City suburb that could appeal to buyers wanting metro access at a lower price point.
- Saint Louis — Missouri’s other major metro, with a wider range of neighborhoods from very affordable to high-end.
Frequently Asked Questions
What is the average home price in Springfield?
The average home price in Springfield, MO is $256,197 as of February 2026. That figure represents the typical home value across seven tracked ZIP codes. Prices range from $132,763 in 65806 to $437,530 in 65809.
Are home prices going up or down in Springfield?
Prices are going up. Springfield’s median home value rose 1.7% year over year. After a brief dip to $250,378 in July 2025, prices have increased every month for seven straight months.
Is it cheaper to rent or buy in Springfield?
In most ZIP codes, renting is cheaper on a monthly basis. Rents range from $1,096 to $1,967 while a mortgage on the median-priced home runs about $1,363 before taxes and insurance. The exception is 65806, where the low home price of $132,763 makes buying significantly cheaper than renting.
What is the most affordable neighborhood in Springfield?
ZIP code 65806 is the most affordable area with a median home value of $132,763 — nearly half the citywide average. Rent there averages $1,096 per month. ZIP 65803 is the next cheapest at $183,725.
Methodology
Home values are based on the Zillow Home Value Index (ZHVI), a smoothed measure of typical home values in the 35th to 65th percentile range. Rent estimates use the Zillow Observed Rent Index (ZORI). Population figures come from the U.S. Census Bureau Population Estimates Program (2020-2024 vintage). All datasets are publicly available. Housing data updated 2026-02-28.