Vancouver Home Prices: $503K, Down 0.5% — 11 ZIPs Analyzed (2026)
$503,408. That’s what a typical home costs in Vancouver, WA right now. Prices slipped 0.5% over the past year, but the decline tells only half the story — values bottomed out last fall and have been quietly rising since September.
Quick answer: The average home price in Vancouver, WA is $503,408 as of February 2026, down 0.5% year over year according to Zillow.
Current Home Prices in Vancouver
Vancouver sits in the Portland-Vancouver-Hillsboro metro, and its median puts it solidly in the half-million-dollar range. Here’s where things stand:
| Metric | Value |
|---|---|
| Median Home Value | $503,408 |
| Year-over-Year Change | -0.5% |
| Lowest ZIP Median | $451,300 |
| Highest ZIP Median | $586,940 |
| Number of ZIPs Tracked | 11 |
| Data as of | February 2026 |
That 0.5% drop amounts to roughly $2,500 in lost value over twelve months. Not a crash. Not a boom. For a market that peaked near $588,000 in spring 2022, the current median reflects a long, slow correction that may be finding its floor.
The spread between cheapest and priciest ZIP codes is $135,640. That gap means your neighborhood pick matters more than citywide trends. A buyer in 98661 pays $451K. A buyer in 98685 pays $587K. Same city, very different price tags.
Vancouver Home Prices by Neighborhood
All 11 Vancouver ZIP codes, ranked from most to least expensive:
| ZIP Code | Median Home Value | Typical Monthly Rent |
|---|---|---|
| 98685 | $586,940 | $2,306 |
| 98686 | $584,888 | $2,058 |
| 98683 | $557,990 | $1,764 |
| 98682 | $496,782 | $1,672 |
| 98665 | $494,739 | $1,797 |
| 98684 | $484,882 | $2,116 |
| 98662 | $478,426 | $1,716 |
| 98664 | $468,821 | $1,615 |
| 98663 | $468,783 | $1,779 |
| 98660 | $463,936 | $1,909 |
| 98661 | $451,300 | $1,663 |
Most Expensive ZIPs
98685 leads at $586,940, sitting 17% above the city median with the highest rents in Vancouver at $2,306/month. 98686 follows closely at $584,888, though rents run lower at $2,058 — suggesting better value for renters relative to home prices. 98683 rounds out the top three at $557,990, carrying moderate rents of $1,764.
Most Affordable ZIPs
98661 is the entry point at $451,300, roughly 10% below the city median and paired with low rents of $1,663. 98660 comes in at $463,936, though its rents are notably higher at $1,909, creating a tighter rent-to-price ratio. 98663 sits at $468,783 with rents of $1,779.

Rent vs Buy in Vancouver
The math favors renters right now.
Across all 11 ZIP codes, the average monthly rent runs about $1,854. A mortgage on the $503,408 median home — assuming 20% down and a 7% rate — costs roughly $2,679 per month in principal and interest. Add property taxes and insurance, and you’re looking at $3,100 or more.
That’s a $1,250/month gap between renting and owning.
| Monthly Cost | Amount |
|---|---|
| Average Rent (ZORI) | ~$1,854 |
| Mortgage P&I (20% down, 7%) | ~$2,679 |
| Estimated Total (taxes + insurance) | ~$3,100+ |
One outlier worth noting: ZIP 98684 charges $2,116/month in rent on a $484,882 home. That rent-to-price ratio is the tightest in the city. If you’re renting there, the ownership premium shrinks.
On the flip side, 98664 has the lowest rents at $1,615 on a $468,821 home. Renting there saves you more than $1,000/month over buying.
Population Growth and Migration
Vancouver added 7,708 residents between 2020 and 2024, a 4.0% growth rate. The city now stands at 198,992 people — closing in on 200,000.
| Year | Population |
|---|---|
| 2020 | 191,284 |
| 2021 | 193,475 |
| 2022 | 194,995 |
| 2023 | 197,733 |
| 2024 | 198,992 |
Growth has been steady, not explosive. The city added about 1,500–2,700 residents each year, with the biggest jump between 2022 and 2023.
How does Vancouver compare to other Washington cities?
| City | 2024 Population | 4-Year Growth |
|---|---|---|
| Seattle | 780,995 | 5.5% |
| Spokane Valley | 108,267 | 4.5% |
| Vancouver | 198,992 | 4.0% |
| Tacoma | 228,202 | 3.8% |
| Everett | 113,011 | 1.9% |
| Bellevue | 154,377 | 1.7% |
Vancouver’s 4.0% growth outpaces Tacoma and Bellevue but trails Seattle and Spokane Valley. For housing, steady population growth without a surge means demand stays consistent without creating the kind of bidding-war pressure seen in faster-growing markets.
Vancouver Housing Market Trends
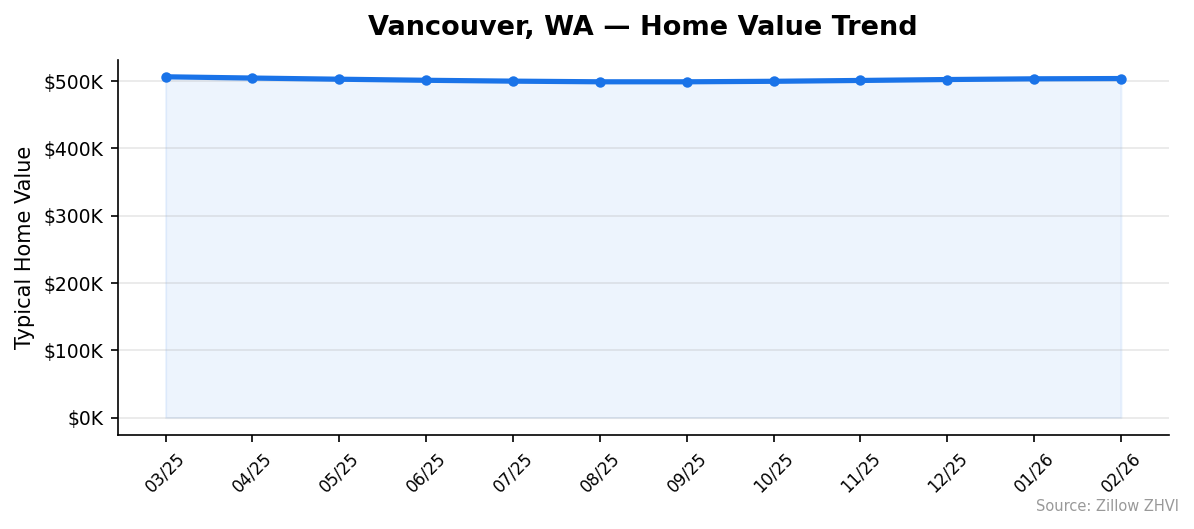
Here’s how the median home value moved over the past 12 months:
| Month | Median Value | Change from Prior Month |
|---|---|---|
| March 2025 | $506,003 | — |
| April 2025 | $504,135 | -$1,868 |
| May 2025 | $502,401 | -$1,734 |
| June 2025 | $500,809 | -$1,592 |
| July 2025 | $499,532 | -$1,277 |
| August 2025 | $498,571 | -$961 |
| September 2025 | $498,568 | -$3 |
| October 2025 | $499,310 | +$742 |
| November 2025 | $500,561 | +$1,251 |
| December 2025 | $501,934 | +$1,373 |
| January 2026 | $502,997 | +$1,063 |
| February 2026 | $503,408 | +$411 |
The pattern is clear. Prices fell steadily from March through September 2025, losing about $7,400. Then they reversed. Since October, values have climbed back roughly $4,800.
September 2025 marked the bottom at $498,568. The decline slowed before it stopped — monthly losses shrank from $1,868 in April to just $3 in September. That kind of deceleration typically signals a turning point, and that’s exactly what happened.
Is Vancouver a Good Place to Buy in 2026?
The data points to a balanced market leaning slightly in buyers’ favor.
Prices are down year over year, which gives you negotiating room that didn’t exist in 2021 or 2022. The 0.5% decline is small enough that sellers aren’t panicking, but it removes the pressure to overbid.
The recovery since September has been gradual, not frantic. Monthly gains of $400–$1,400 suggest organic demand rather than speculative buying.
If you’re comparing to Portland across the river, Vancouver offers Washington’s lack of state income tax — a real savings for high earners. With the median at $503K, you’re paying less than many Portland neighborhoods while keeping metro access.
The risk? Mortgage rates. At 7%, the monthly payment is steep. If rates drop, you can refinance. If they don’t, that $3,100+/month payment is the reality.
Vancouver Housing Market Outlook for 2026-2027
The five-month upward trend suggests prices will continue rising modestly through spring and summer 2026. If the current pace holds — roughly $1,000/month gains — the median could push back toward $510,000 by mid-summer.
But the gains are slowing. February’s increase was just $411, down from $1,373 in December. That deceleration could mean the recovery is losing steam, or it could be normal seasonal flattening before the spring buying season adds momentum.
The 12-month trend suggests Vancouver won’t see dramatic moves in either direction. A year from now, expect prices somewhere between $500,000 and $515,000 — barring a major shift in mortgage rates or employment in the Portland metro.
Similar Markets in WA
If you’re considering Vancouver, these Washington cities offer different price points:
- Seattle — The state’s largest city, growing at 5.5%, with significantly higher home prices than Vancouver.
- Everett — North of Seattle with slower population growth at 1.9%, potentially more affordable.
- Spokane — Eastern Washington offers a different market entirely, with lower prices and a smaller metro area.
- Olympia — The state capital, a smaller market south of Tacoma.
- Puyallup — A suburban option in the Tacoma metro with its own price dynamics.
Frequently Asked Questions
What is the average home price in Vancouver?
The average home price in Vancouver, WA is $503,408 as of February 2026. Across the city’s 11 tracked ZIP codes, values range from $451,300 to $586,940.
Are home prices going up or down in Vancouver?
Prices are down 0.5% compared to a year ago. However, the monthly trend reversed in October 2025, and values have been climbing since. The year-over-year number reflects a mid-2025 dip that the market has partially recovered from.
Is it cheaper to rent or buy in Vancouver?
Renting is cheaper. The average rent across Vancouver runs about $1,854/month. A mortgage on the median home costs roughly $2,679/month in principal and interest alone — before taxes and insurance push the total past $3,100.
What is the most affordable neighborhood in Vancouver?
ZIP code 98661 has the lowest median home value at $451,300, about $52,000 below the city average. Rents there are also among the lowest at $1,663/month.
Methodology
Home values are based on the Zillow Home Value Index (ZHVI), a smoothed measure of typical home values in the 35th to 65th percentile range. Rent estimates use the Zillow Observed Rent Index (ZORI). Population figures come from the U.S. Census Bureau Population Estimates Program (2020-2024 vintage). All datasets are publicly available. Housing data updated 2026-02-28.