Puyallup Home Prices: $585K, Down 0.6% — 5 ZIPs Analyzed (2026)
$585,265. That’s what a typical home in Puyallup costs right now — down 0.6% from a year ago. Prices bottomed out last July at $577,565 and have climbed every month since.
Quick answer: The average home price in Puyallup, WA is $585,265 as of February 2026, down 0.6% year over year according to Zillow.
Current Home Prices in Puyallup
Puyallup sits inside the Seattle-Tacoma-Bellevue metro, but it trades at roughly 25% below the Seattle city median. Here’s where the numbers stand today.
| Metric | Value |
|---|---|
| Median home value | $585,265 |
| Year-over-year change | -0.6% |
| Cheapest ZIP | $544,991 (98375) |
| Most expensive ZIP | $619,657 (98372) |
| Price spread across ZIPs | $74,666 |
| ZIPs analyzed | 5 |
| Metro area | Seattle-Tacoma-Bellevue, WA |
The 0.6% drop is modest. It’s not a crash and it’s not stagnation — it’s a soft reset after the post-2021 run. The $74,666 gap between the cheapest and priciest ZIP tells you most of what you need to know about Puyallup: it’s a small market with a narrow price band. You won’t find $300,000 homes. You also won’t find $900,000 homes.
What you will find is a cluster of neighborhoods pricing within about 13% of each other, which makes the decision less about budget and more about which ZIP fits your life.
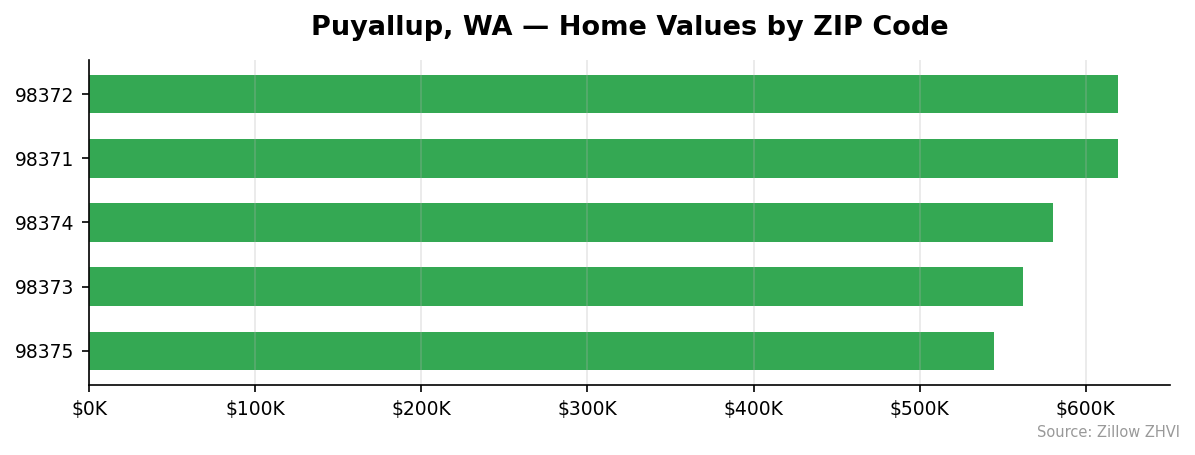
Puyallup Home Prices by Neighborhood
Five ZIP codes cover the city. The rent data tells a strange story — the cheapest homes command the highest rent.
| ZIP | Median Home Value | Median Rent |
|---|---|---|
| 98372 | $619,657 | $1,894 |
| 98371 | $619,300 | $1,993 |
| 98374 | $579,980 | $2,308 |
| 98373 | $562,398 | $1,863 |
| 98375 | $544,991 | $2,650 |
Most Expensive
- 98372 — $619,657. The priciest ZIP, about 6% above the city median, but rents sit at just $1,894. The buy-to-rent gap here is wide, which usually signals owner-occupied neighborhoods rather than rental stock.
- 98371 — $619,300. Nearly identical to 98372 on price ($357 apart). Rent runs $1,993, slightly higher but still below the city rent average.
- 98374 — $579,980. Right at the city median. Rent is $2,308 — the second-highest in Puyallup, which puts its rent-to-price ratio above the pricier ZIPs.
Most Affordable
- 98375 — $544,991. The cheapest ZIP by a $17,000 margin. But the rent is $2,650 per month — the highest in the city. That combination is unusual and suggests newer rental inventory or higher-demand tenant pools.
- 98373 — $562,398. About 4% below the city median. Rent is the lowest in Puyallup at $1,863, giving it the friendliest price point for buyers and renters alike.
- 98374 — $579,980. Not technically in the bottom two, but the next cheapest. See above.
Rent vs Buy in Puyallup
Average rent across the five Puyallup ZIPs works out to roughly $2,142 per month. Buying the median home at $585,265 tells a different story.
With 20% down ($117,053) and a 30-year mortgage at 7%, monthly principal and interest lands near $3,114. Add property taxes (about $450/month based on WA rates around 0.9%) and homeowners insurance (roughly $150/month), and your monthly housing cost is about $3,714. Factor in maintenance at 1% of home value annually ($488/month) and you’re closer to $4,200.
| Monthly cost | Rent | Buy (20% down) |
|---|---|---|
| Housing payment | $2,142 | $3,714 |
| With maintenance reserve | — | $4,202 |
Renting saves roughly $1,570 per month cash flow, or $2,060 per month including maintenance reserves. Over five years, that’s $94,000 to $124,000 — more than your down payment would have been.
The math shifts in the buyer’s favor if Puyallup prices appreciate meaningfully, or if you stay 7+ years and benefit from tax deductions and principal paydown. At today’s prices and rates, renting is the cheaper monthly option by a wide margin.
Population Growth and Migration
Puyallup is losing people. Slowly, but consistently.
| Year | Population |
|---|---|
| 2020 | 43,037 |
| 2021 | 43,015 |
| 2022 | 42,712 |
| 2023 | 42,484 |
| 2024 | 42,552 |
The 4-year change is -1.1%. The 2024 number shows a small rebound (+68 residents from 2023), but the trend line points down from the 2020 peak.
That’s unusual for the Puget Sound region. Here’s how nearby cities performed over the same period:
| City | 2024 Population | 4-Year Growth |
|---|---|---|
| Seattle | 780,995 | +5.5% |
| Spokane Valley | 108,267 | +4.5% |
| Vancouver | 198,992 | +4.0% |
| Tacoma | 228,202 | +3.8% |
| Everett | 113,011 | +1.9% |
| Puyallup | 42,552 | -1.1% |
Every major city in Washington gained residents. Puyallup lost them. That matters for housing demand — when population softens, so does the pressure on prices. The 0.6% YoY price dip is consistent with that demand story.
Puyallup Housing Market Trends
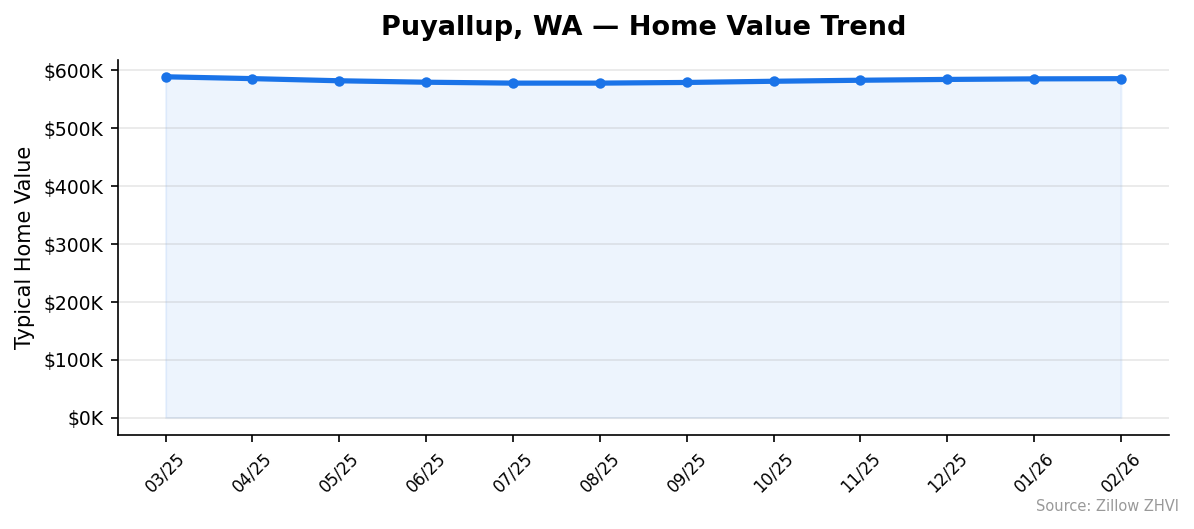
Prices dropped for four straight months last year, bottomed in July, then climbed for seven straight months.
| Month | Median Value |
|---|---|
| March 2025 | $588,505 |
| April 2025 | $585,332 |
| May 2025 | $581,624 |
| June 2025 | $579,121 |
| July 2025 | $577,565 |
| August 2025 | $577,578 |
| September 2025 | $578,711 |
| October 2025 | $580,781 |
| November 2025 | $582,545 |
| December 2025 | $583,942 |
| January 2026 | $584,912 |
| February 2026 | $585,265 |
The peak-to-trough drop from March to July was $10,940, or 1.9%. The recovery since July has added $7,700 back. You’re looking at a market that corrected about 2% last spring, then spent the next seven months slowly healing.
The February-to-January move was just $353. Momentum is positive but tired.
Is Puyallup a Good Place to Buy in 2026?
The case for waiting: population is shrinking, the YoY number is still negative, and renting costs roughly half of owning on a monthly basis. If you’re not staying at least 5-7 years, the math doesn’t pencil out.
The case for buying: prices have risen seven months in a row. Inventory sits in a tight band between $545K and $620K, so you’re not catching a falling knife — the correction already happened and the recovery is underway. If rates drop in the next 12-18 months, today’s prices lock in before the next leg up.
For now, it’s a balanced market leaning slightly toward buyers. Sellers aren’t getting bidding wars. Buyers aren’t getting fire sales.
Puyallup Housing Market Outlook for 2026-2027
The 3-month trend (December through February) added $1,323 — a pace of roughly $440 per month. That’s barely above flat.
The 7-month recovery from the July trough ran at about $1,100 per month. If that pace continues, Puyallup crosses $590K by late summer 2026 and could test $600K by early 2027.
The drag on that forecast is population. A shrinking resident base caps how fast prices can climb without outside demand from Seattle-Tacoma spillover buyers. If Seattle commuter demand holds, the recovery continues. If it softens, Puyallup could retest the July 2025 low of $577K.
Similar Markets in WA
- Tacoma-adjacent Seattle runs much higher than Puyallup — worth checking if you want to see the metro’s upper end.
- Everett offers another Puget Sound price point north of the city.
- Bothell sits higher up the price ladder — a comparison point if you’re eyeing east-side options.
- Olympia is the closest southern alternative and typically trades below Puyallup levels.
- Bellingham gives you a college-town comparison further north in the state.
Frequently Asked Questions
What is the average home price in Puyallup?
The typical home in Puyallup, WA is worth $585,265 as of February 2026. That’s based on the Zillow Home Value Index across five ZIP codes. Prices range from $544,991 in 98375 to $619,657 in 98372.
Are home prices going up or down in Puyallup?
Prices are down 0.6% year over year. But the month-over-month story is different — values have risen for seven straight months since bottoming at $577,565 in July 2025. The recovery has added about $7,700 back.
Is it cheaper to rent or buy in Puyallup?
Renting is cheaper by a wide margin. Average monthly rent is $2,142 across the five ZIPs, while a mortgage on the median-priced home costs about $3,714 per month with 20% down at 7%. That’s a $1,572 monthly gap before maintenance costs.
What is the most affordable neighborhood in Puyallup?
ZIP 98375 is the cheapest at $544,991 — about 7% below the city median. The wrinkle: it also has the highest rent in the city at $2,650 per month, which is unusual and suggests newer rental stock or higher tenant demand in that area.
Methodology
Home values are based on the Zillow Home Value Index (ZHVI), a smoothed measure of typical home values in the 35th to 65th percentile range. Rent estimates use the Zillow Observed Rent Index (ZORI). Population figures come from the U.S. Census Bureau Population Estimates Program (2020-2024 vintage). All datasets are publicly available. Housing data updated 2026-02-28.